LTspice-Temperature Analysis(.temp)
In this article, we will explain in detail the temperature analysis(.temp) method in LTspice.
Temperature analysis analyzes the effects of temperature characteristics of semiconductors such as op-amps and transistors in electronic circuits.
It is performed simultaneously with transient analysis, AC analysis, DC sweep analysis, etc.
For the types of analysis, please see the following article.

Prepare a schematic
First, prepare a schematic for temperature analysis with LTspice.

Perform temperature analysis using the schematic in the following article. If you have not drawn a schematic with LTspice, we recommend that you draw a schematic before analysis.
In addition, since the schematic was prepared here, if you want to start analysis immediately, download it by clicking the link below.
Op-amp change
Because the LT1028 SPICE model does not have a built-in temperature characteristic, no change is seen in the temperature analysis.
Therefore, temperature analysis is performed by changing to the OP113 SPICE model, which has built-in temperature characteristics.
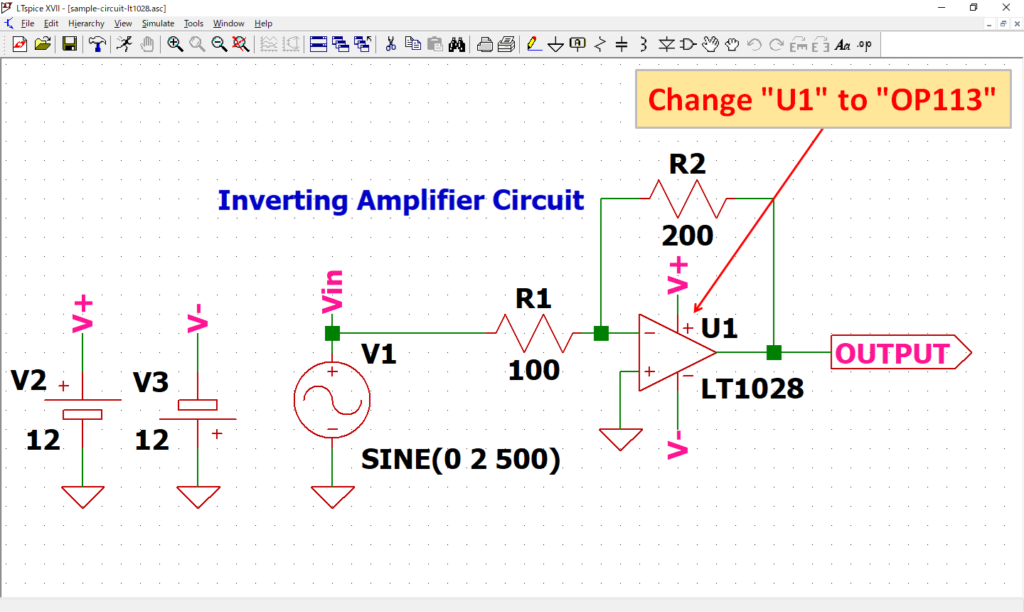
Change op amp U1 to OP113. The change procedure is to delete the LT1028 and select OP113 from "Component" on the toolbar to place it on the schematic.
Refer to the following article for the operation method of schematic drawing.
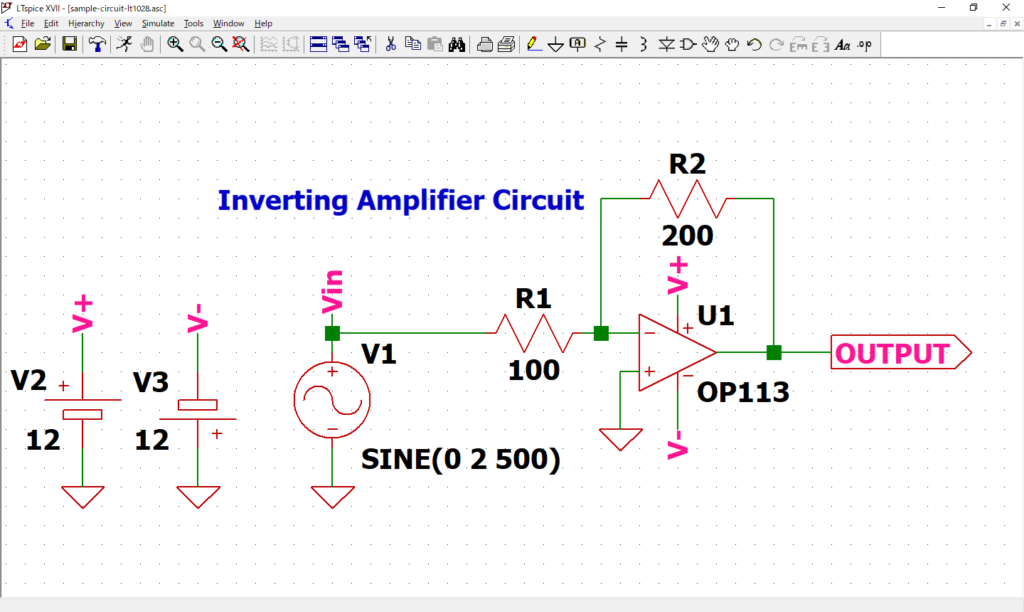
There is no problem if the op-amp U1 is changed to OP113 as shown in the schematic above.
Signal source setting
We have already set the signal source in the article of "How to Draw a Schematic".
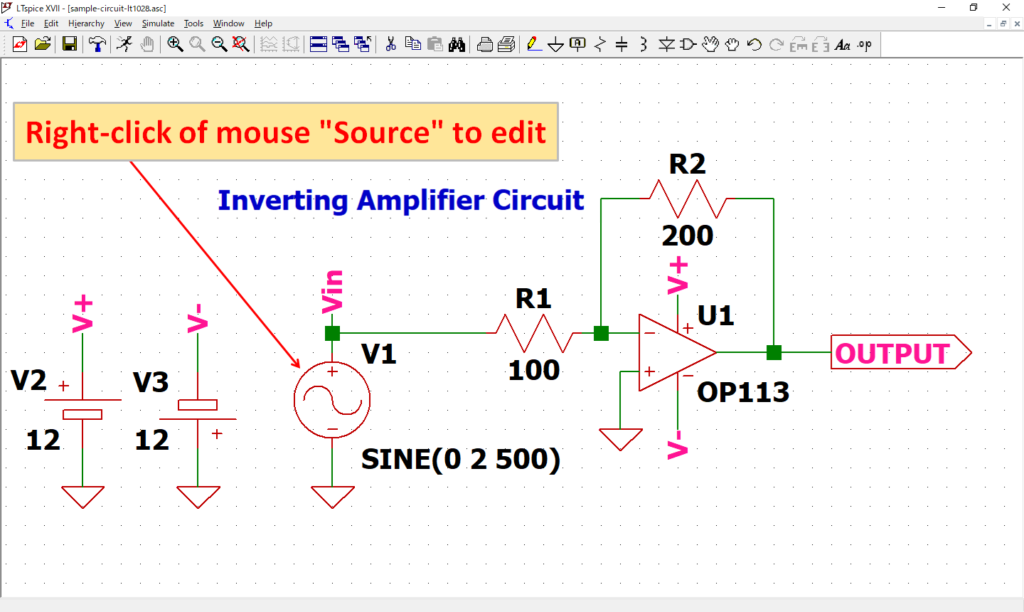
Open the “Independent Voltage Source” screen by “right-clicking” the signal source V1 of the schematic with the mouse.
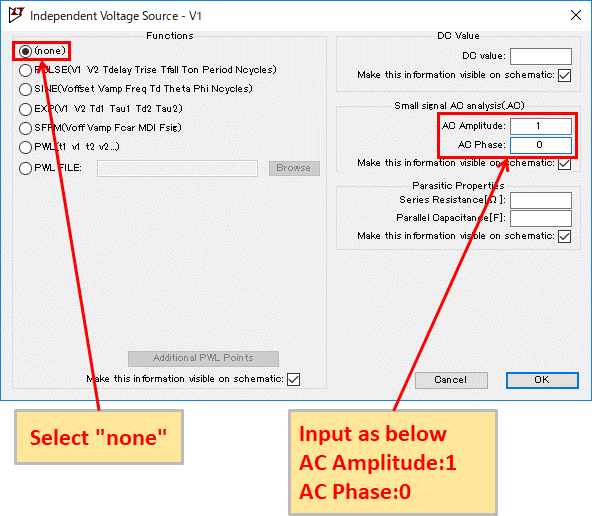
Select none and enter AC Amplitude: 1, AC Phase: 0 (can be blank).
(AC analysis can be performed even if the signal source is SINE, but it is misleading, so we recommend changing it.)
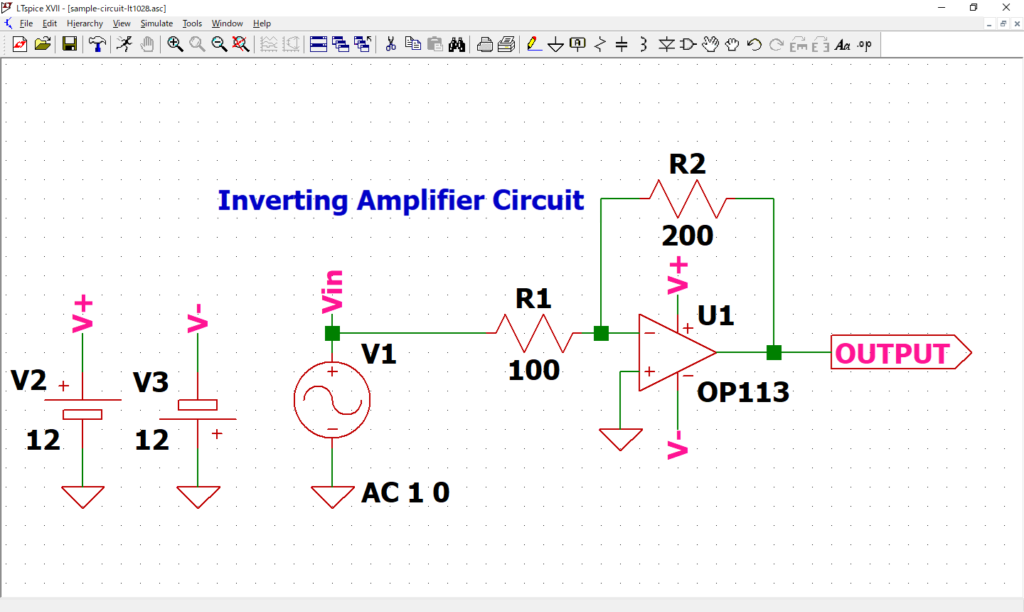
Make sure that “AC 1 0” is listed near source V1.
Refer to the following article for the detailed setting method of the signal source.
AC Analysis(.ac) Setting
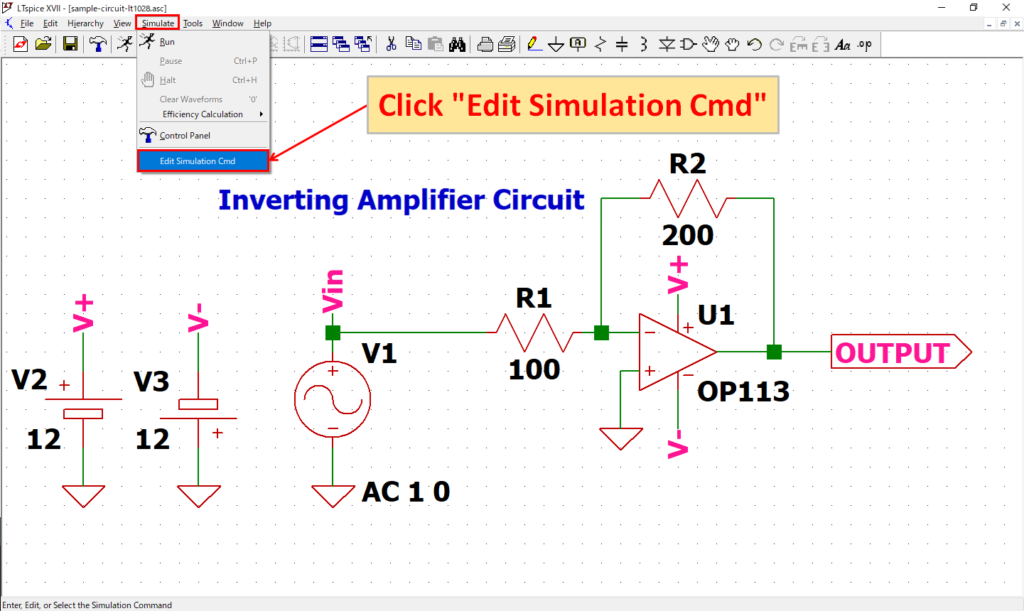
Click “Simulate”-“Edit Simulation Cmd” in the menu bar to open the “Edit Simulation Command” screen.
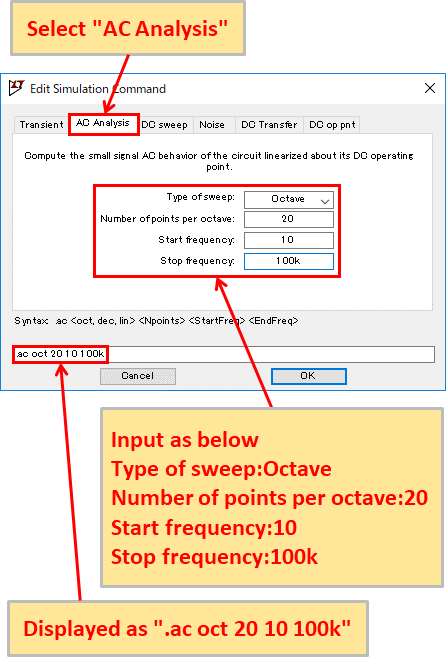
Select "AC Analysis" and enter Type of sweep: Octave, Number of points per octave: 20, Start frequency: 10, Stop frequency: 100k. You should now see ".ac oct 20 10 100k" at the bottom of the screen.
Now the frequency is doubled (Octave), the analysis point is 20, and it is set to perform AC analysis from 10Hz to 100kHz.
In addition, LTspice can use auxiliary units as shown in the following table.
Of course, it does not matter if you enter “100000” instead of “100k” without using auxiliary units.
Auxiliary unit of LTspice
| Unit (prefix) | Unit | Multiple |
|---|---|---|
| T | tera | 1012 |
| G | giga | 109 |
| Meg | mega | 106 |
| k | kilo | 103 |
| m | milli | 10-3 |
| u | micro | 10-6 |
| n | nano | 10-9 |
| p | pico | 10-12 |
| f | femto | 10-15 |
Refer to the following article for the detailed setting method of AC analysis.
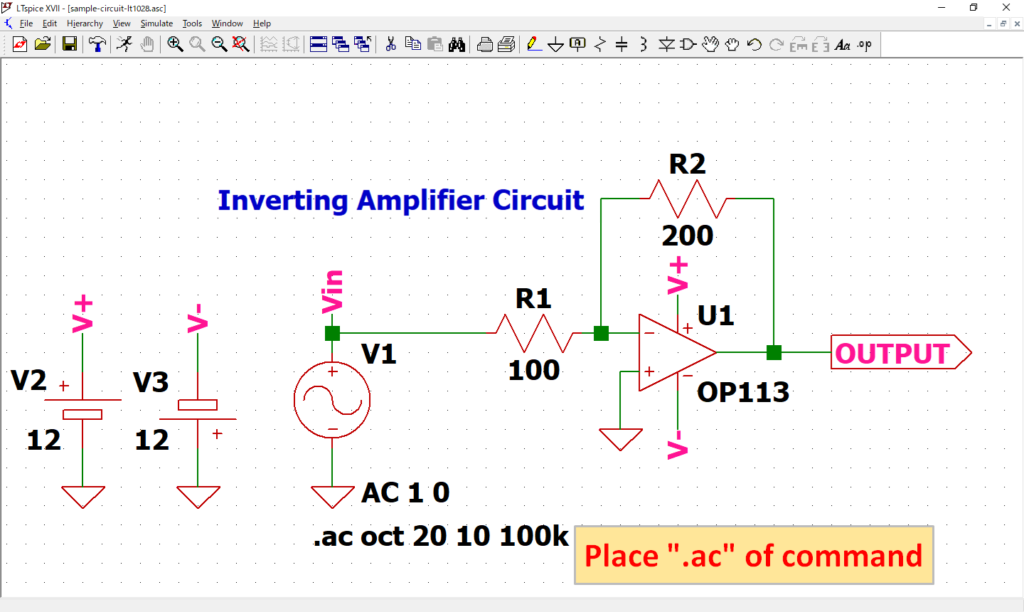
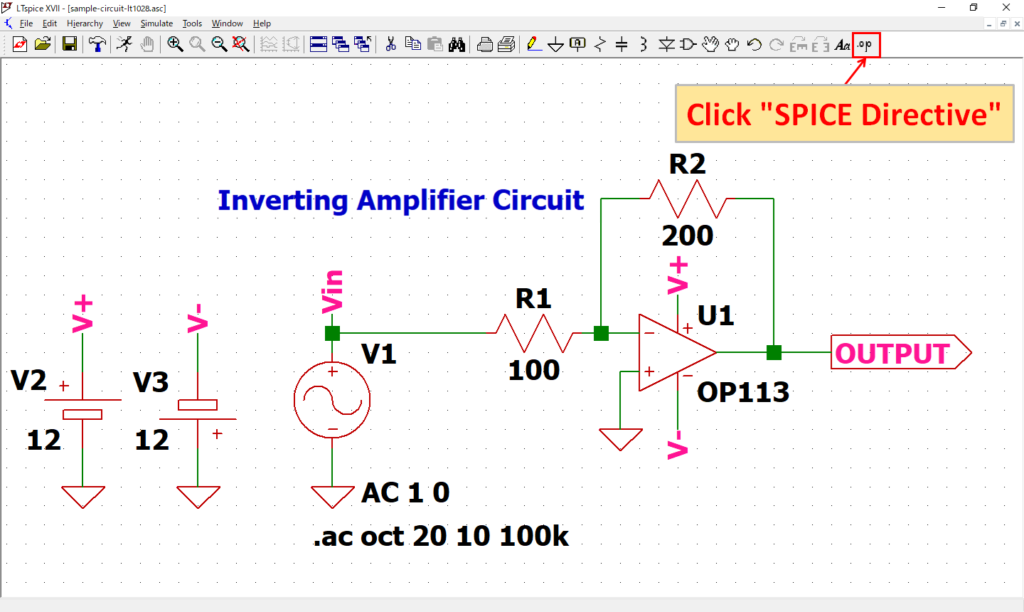
As “.ac oct 20 10 100k” of dot command appear, place it at an appropriate position. In this article, it was placed near source V1.
Although the “.ac” of dot command was created from the screen of “Edit Simulation Command”, it can also be created by “Edit Text on the Schematic”.
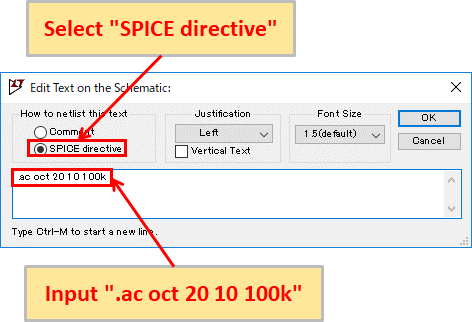
Click “SPICE Directive” on the toolbar to display “Edit Text on the Schematic” screen.
Make sure that the “SPICE directive” is selected, enter the dot command syntax (“.ac oct 20 10 100k” in this case), and click OK to place the created dot command.
Temperature Analysis(.temp)
Click “SPICE Directive” on the toolbar to display “Edit Text on the Schematic” screen.
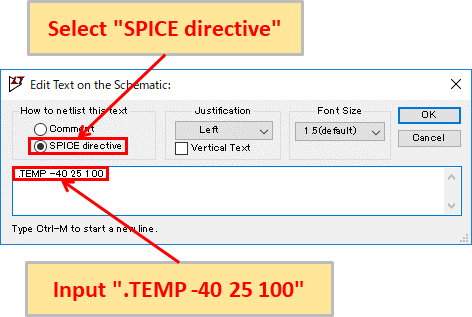
Make sure the “SPICE directive” is selected and enter “.TEMP -40 25 100”.
This is the setting for performing temperature analysis at temperatures of -40°C, 25°C, and 100°C.
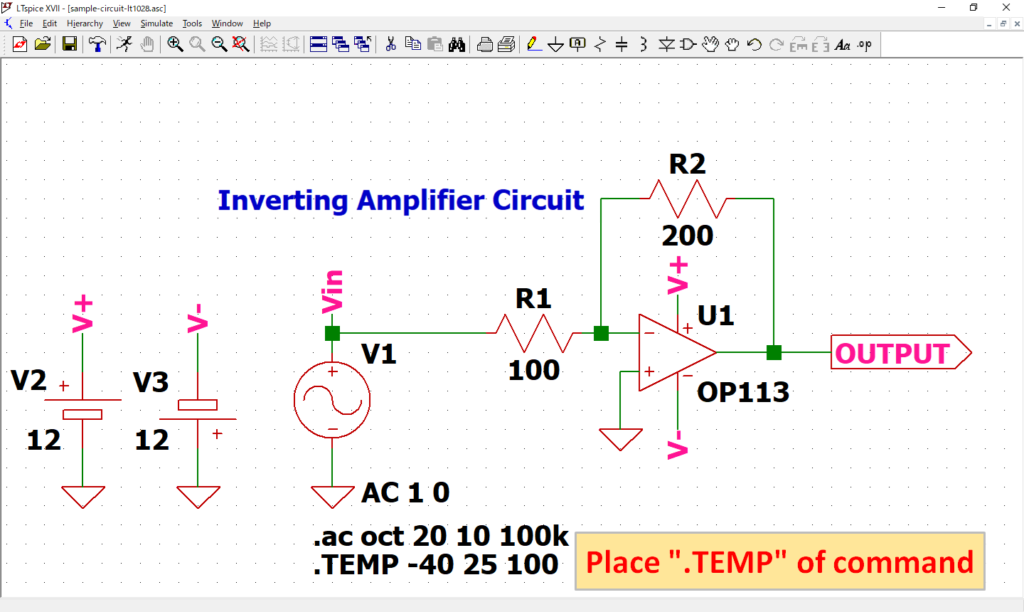
A dot command of .TEMP appears, so place it at an appropriate position. In this article, it was placed near source V1.
Simulation
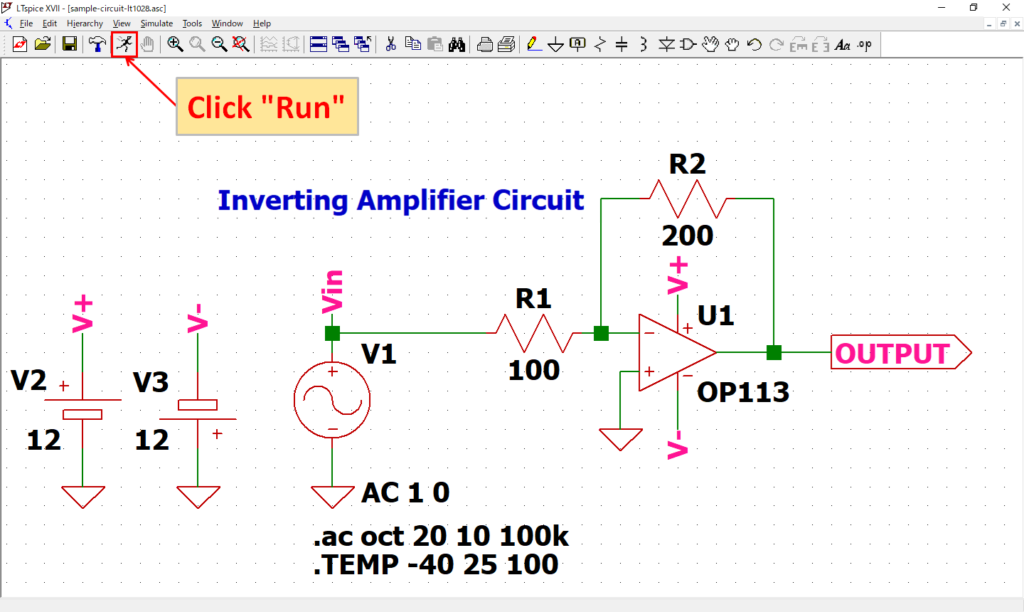
Click “Run” on the toolbar to run the simulation. The simulation time varies depending on the size of the circuit.
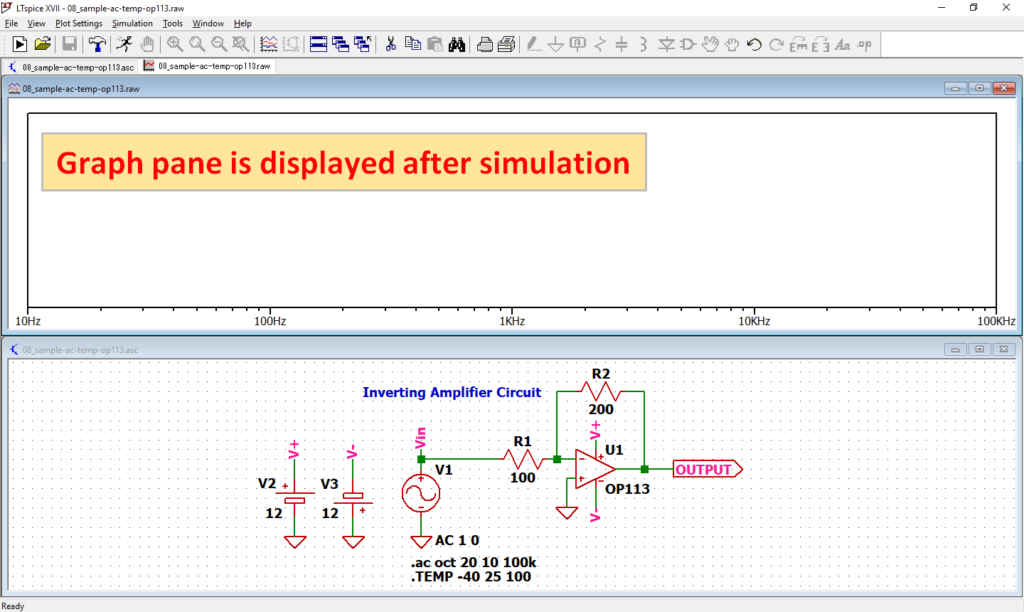
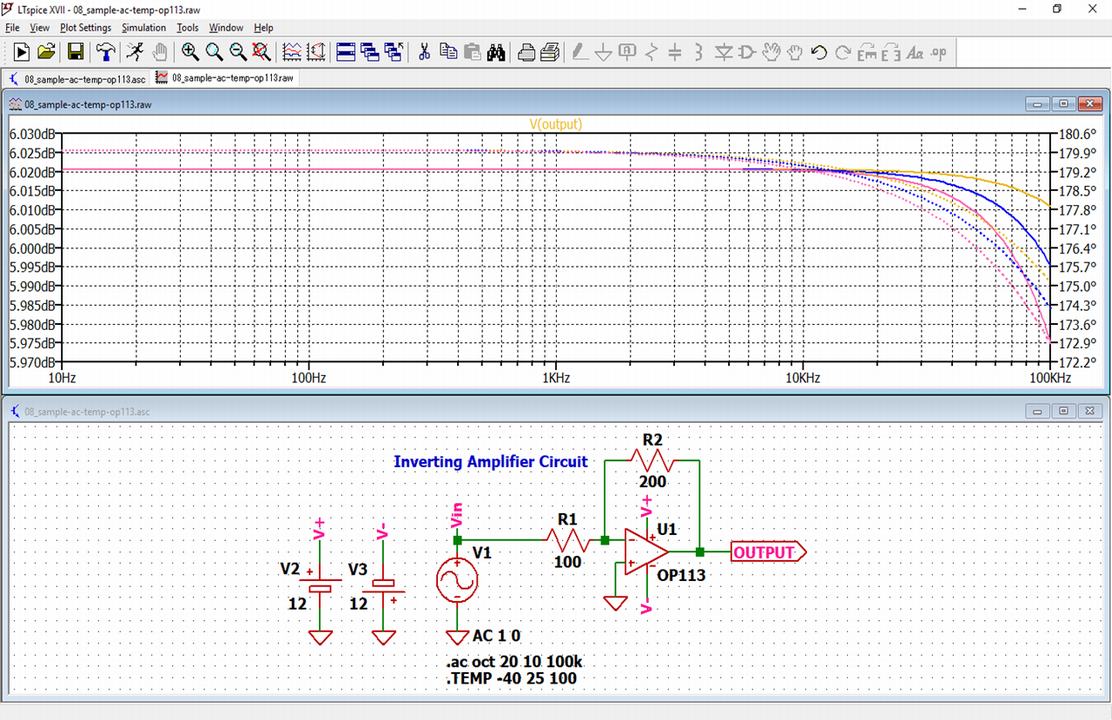
After simulation, the graph pane will appear at the top of the schematic with the default settings of LTspice.
If you want to lay out the schematic editor and graph pane, see the following article, “Display the schematic editor and waveform graph side by side”.
Analysis result
In this article, we would like to easily check the analysis results with the LTspice voltage probe.
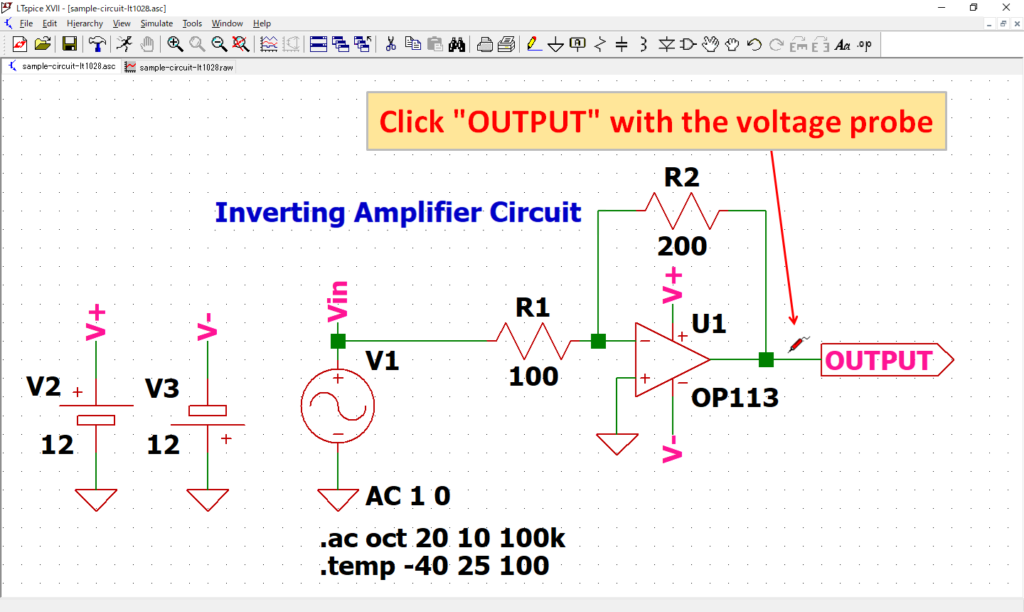
After simulation, when you move the cursor close to the schematic wiring, the cursor changes to “voltage probe”.
Click “OUTPUT” with the voltage probe.
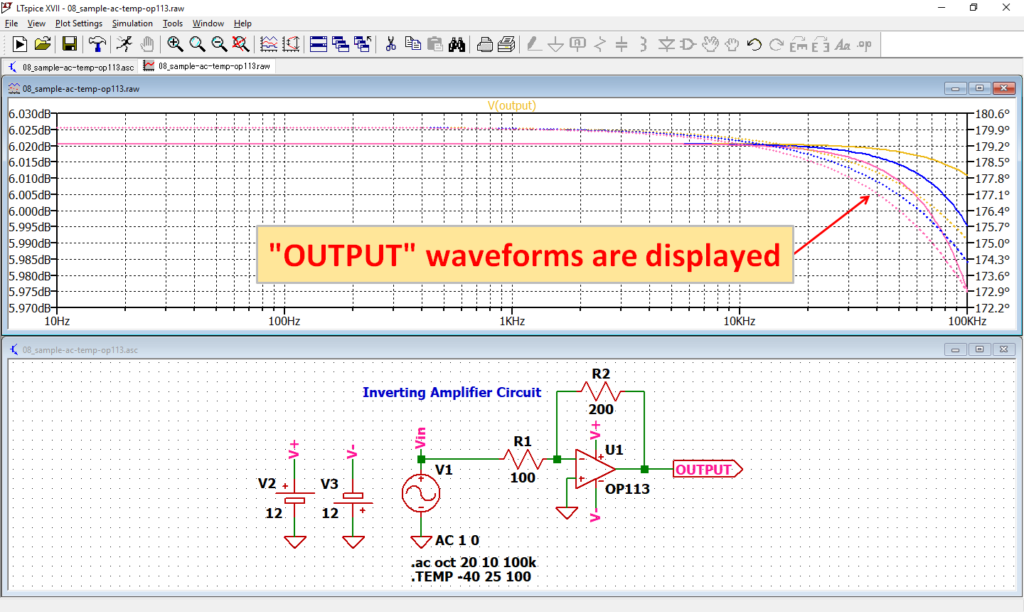
The waveforms of OUTPUT appear on the graph pane.
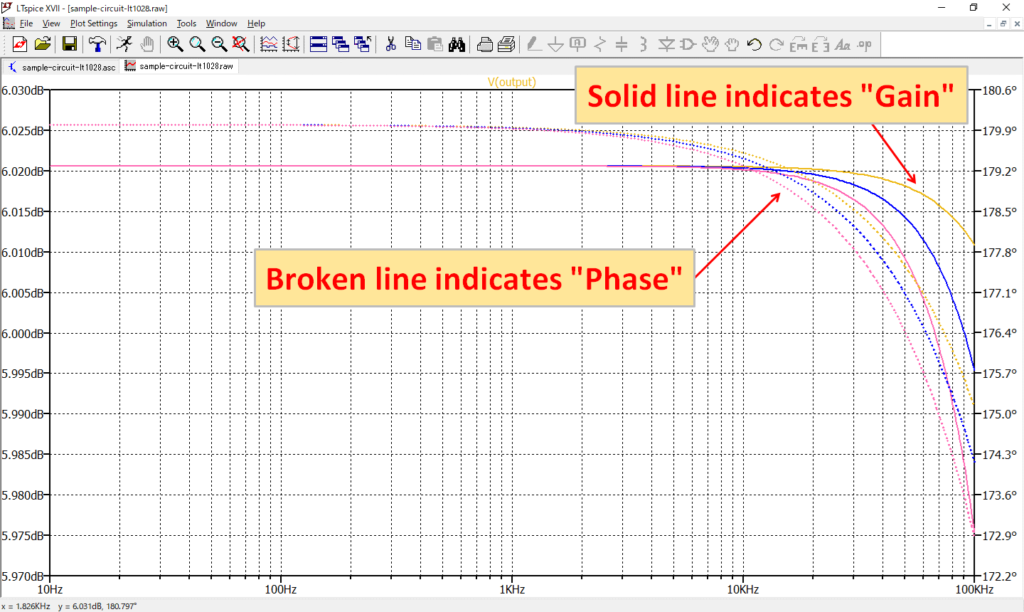
The solid line is the gain waveform, and the broken line is the phase waveform. You can see that the change in temperature is seen from around 10 kHz in frequency.
In this article, we only used the waveform viewer to check V(OUTPUT) gain and phase waveforms with a voltage probe.
For more information on how to use the waveform viewer, see the following articles:
The schematic used for the temperature analysis can be downloaded from the link below.