LTspice-How to use Waveform Viewer
This article details how to use LTspice's Waveform Viewer.
The waveform viewer is a function that displays the simulation results executed with LTspice as a graph. It is easy to understand if you imagine the measurement with an oscilloscope.
For the types of analysis, please see the following article.

How do I use the Waveform Viewer?
To use the Waveform Viewer with LTspice, you need to run a simulation on the schematic of LTspice.
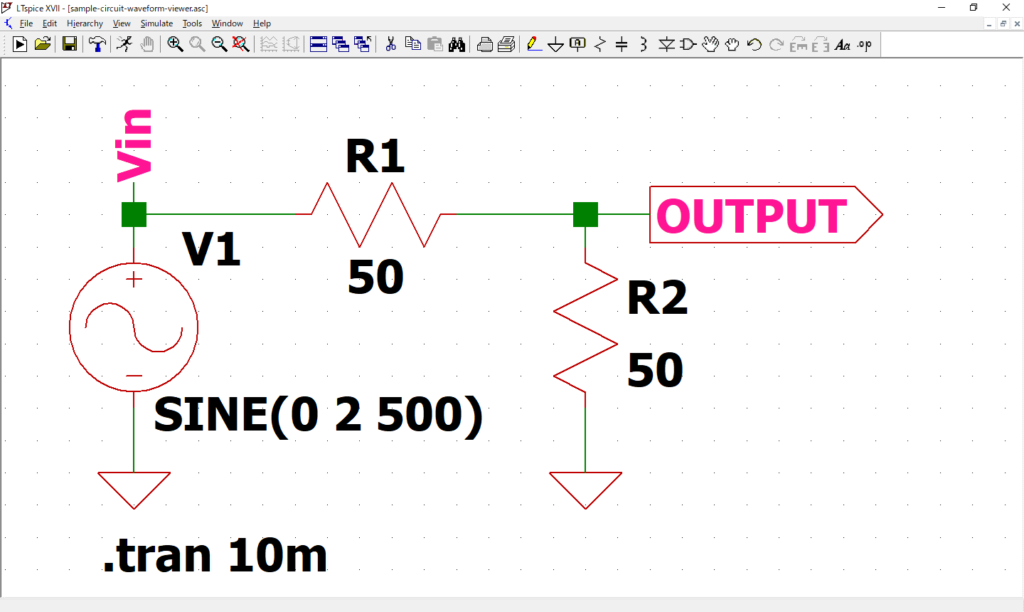
In this article, we will use the following schematic as an example to explain the Waveform Viewer.
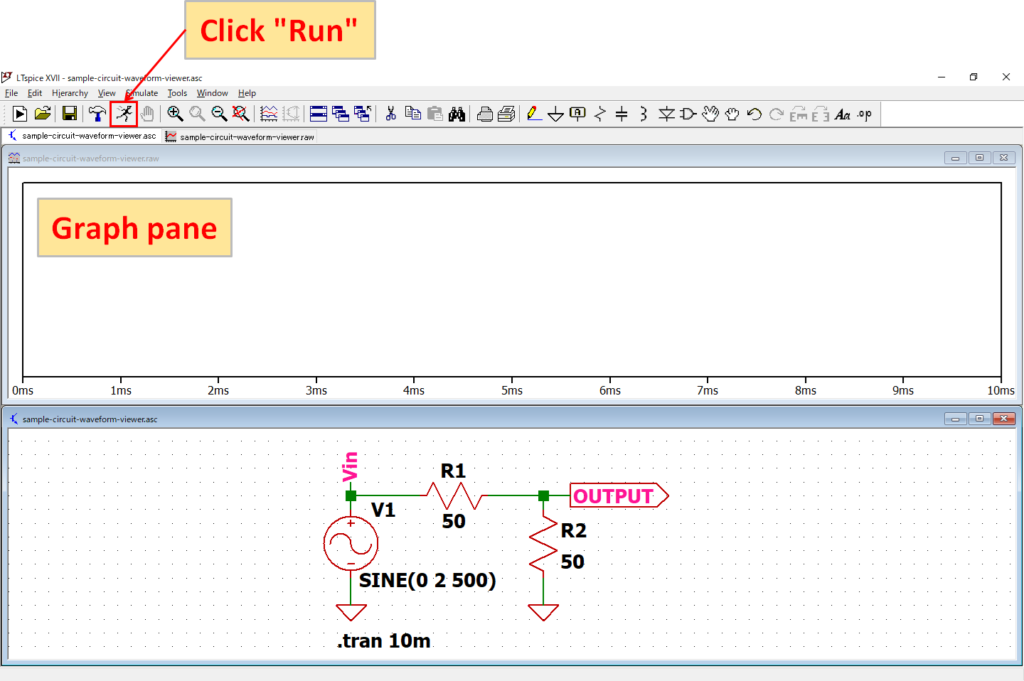
Click “Run” on the toolbar to start simulation and automatically display the graph pane.
The schematic used in this article can be downloaded from the link below.
Waveform display on the probe
The following types of probes can be used to easily display voltage, current and power waveforms.
Probe type
| Icon | Probe | Explanation |
|---|---|---|
| Voltage probe | When you move the cursor close to the schematic wiring, “Voltage probe” of the tester terminal will be displayed. | |
| Current probe | When you move the cursor to a part of the schematic, “Current probe” of the clamp meter is displayed. Also, if you move to the schematic wiring while holding down the Alt key, the current probe will be displayed as well. | |
| Watt meter | When move the cursor to the part of the schematic while pressing the Alt key, "Watt meter" of the thermometer will be displayed. |
Note that some probes may not be available depending on the type of analysis, as shown below. This article will explain transient analysis as an example.
Analysis that can use probe
| Analysis method | Voltage probe | Current probe | Watt meter |
|---|---|---|---|
| Transient Analysis (.tran) | 〇 | 〇 | 〇 |
| AC Analysis (.ac) | 〇 | 〇 | × |
| DC Sweep Analysis (.dc) | 〇 | 〇 | 〇 |
| Noise Analysis (.noise) | 〇 | × | × |
| DC Transfer Function Analysis (.tf) | × | × | × |
| DC Operating Point Analysis (.op) | × | × | × |
| Temperature Analysis (.temp) | 〇 | 〇 | × |
Voltage
When you move the cursor close to the schematic wiring, it changes to a voltage probe.
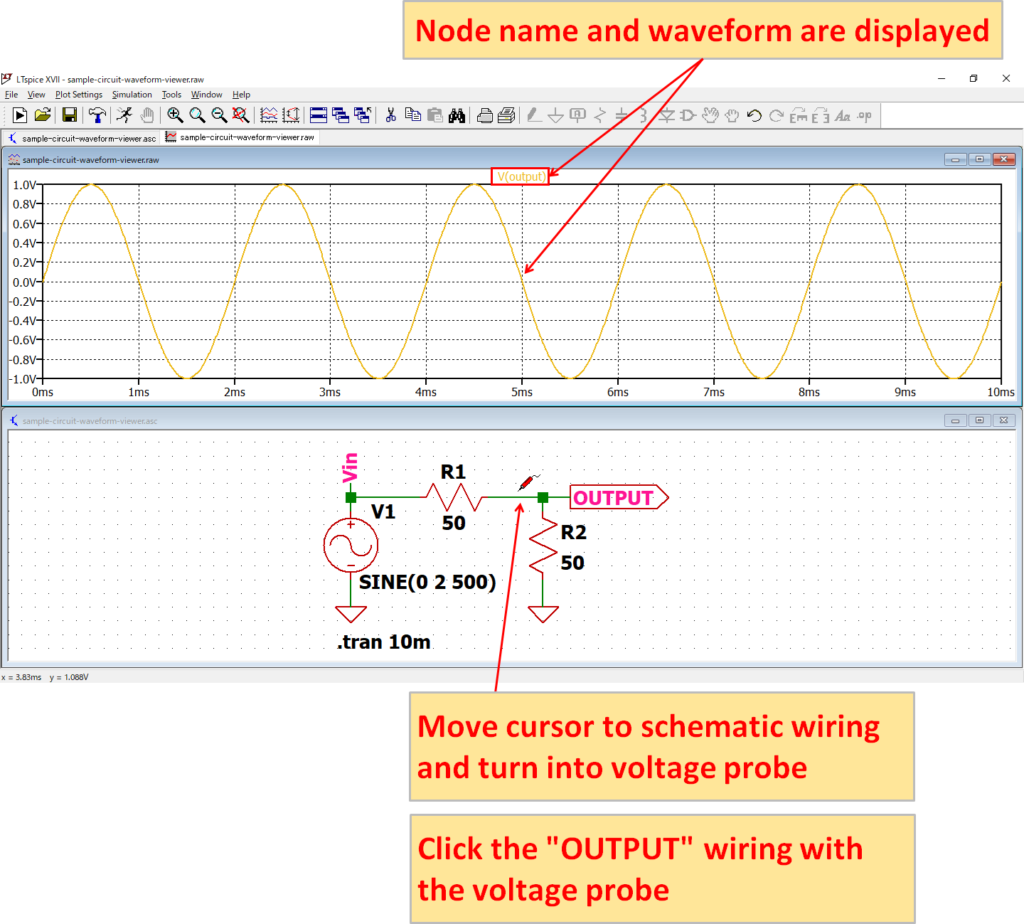
This time, let's display the voltage waveform of “OUTPUT” using a voltage probe.
When you move the cursor close to the “OUTPUT” wiring, it changes to a voltage probe, so just click “left click” of the mouse.
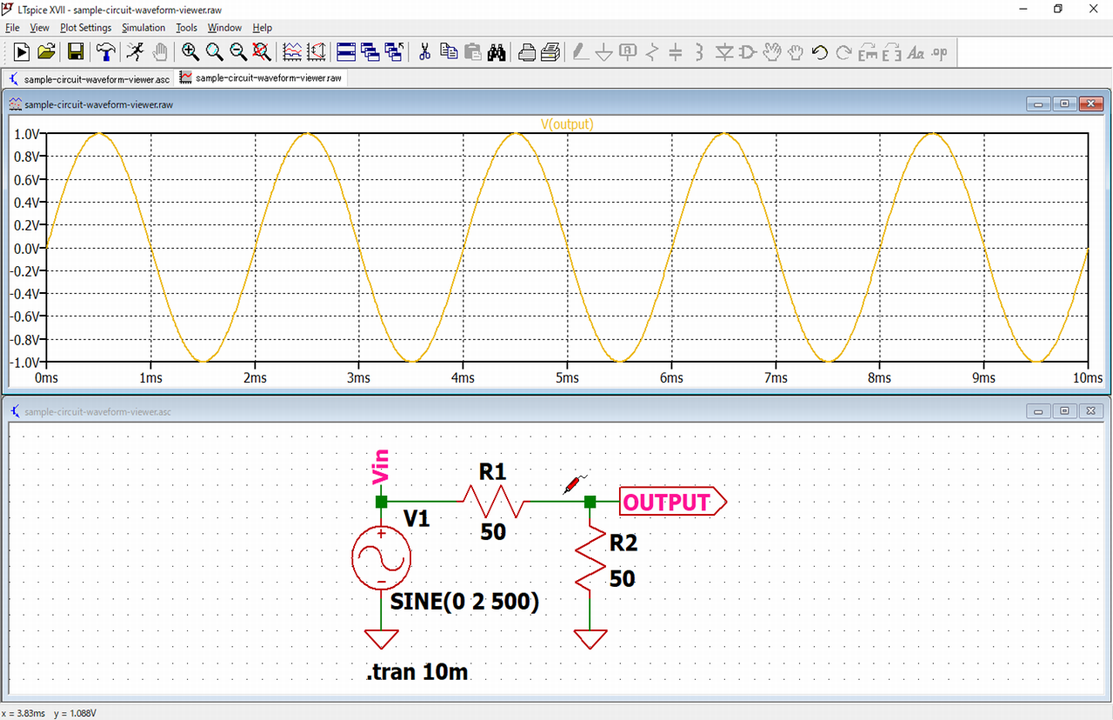
Then, the voltage waveform of "OUTPUT" and the node name are displayed on the graph pane.
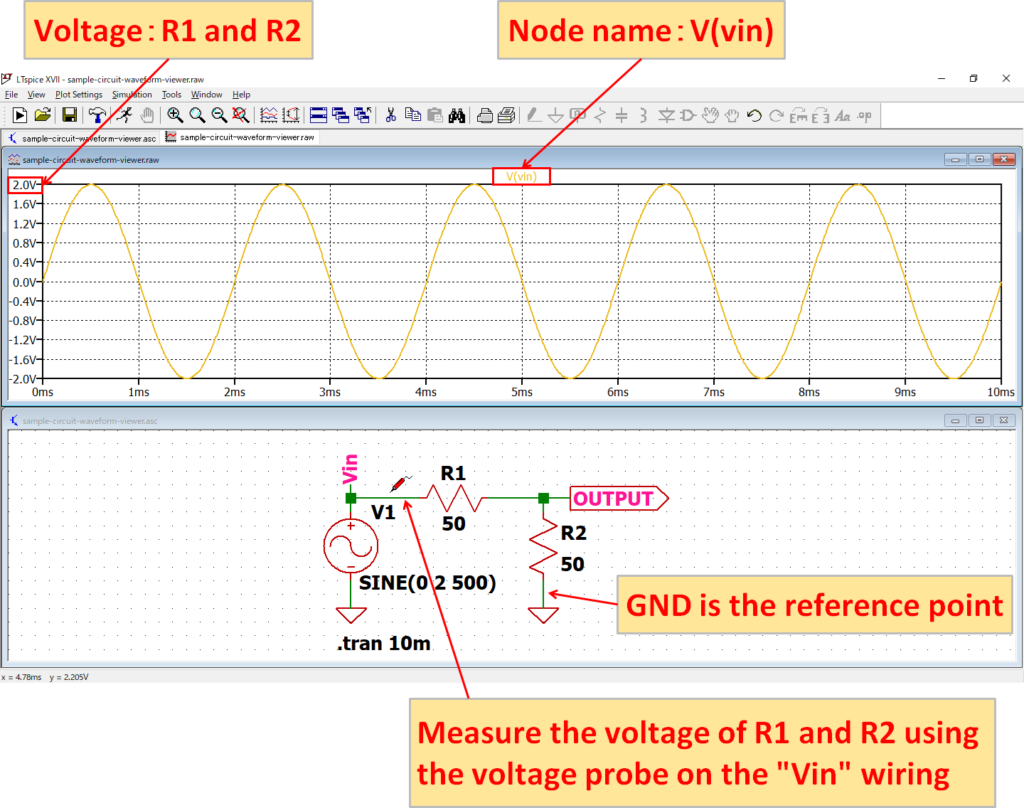
Take care when measuring the voltage across the part. For example, if you want to measure the voltage across R1 and click on the left side of R1 with a voltage probe, you will measure the voltage across R1 and R2 because GND is the reference point.
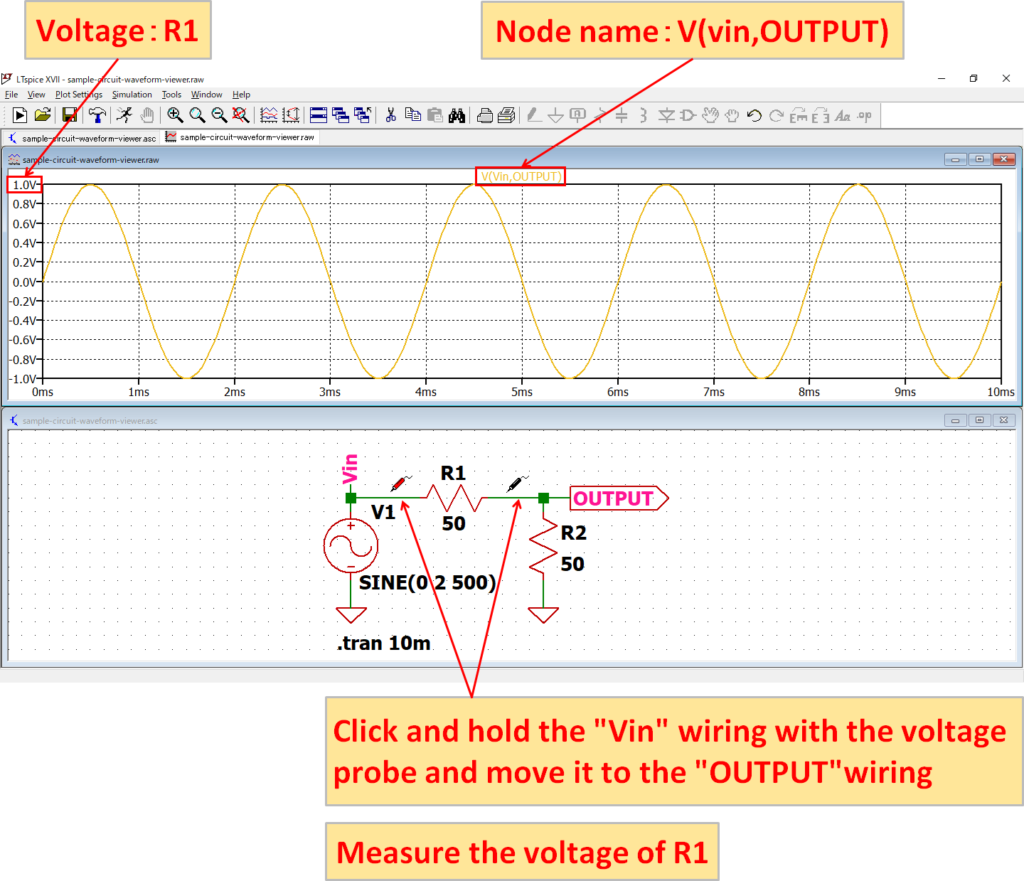
To measure the voltage across R1, it is necessary to move one of R1's terminals to the other terminal of R1 and release it while left-clicking with the mouse.
At this time, you can see that the voltage probe switches from "red" to "black". This black voltage probe is the reference point.
Current
When you move the cursor to a part of the schematic, it changes to a current probe. Also, if you move the cursor while holding down the "Alt" key in the schematic wiring, it will change to a current probe as well.
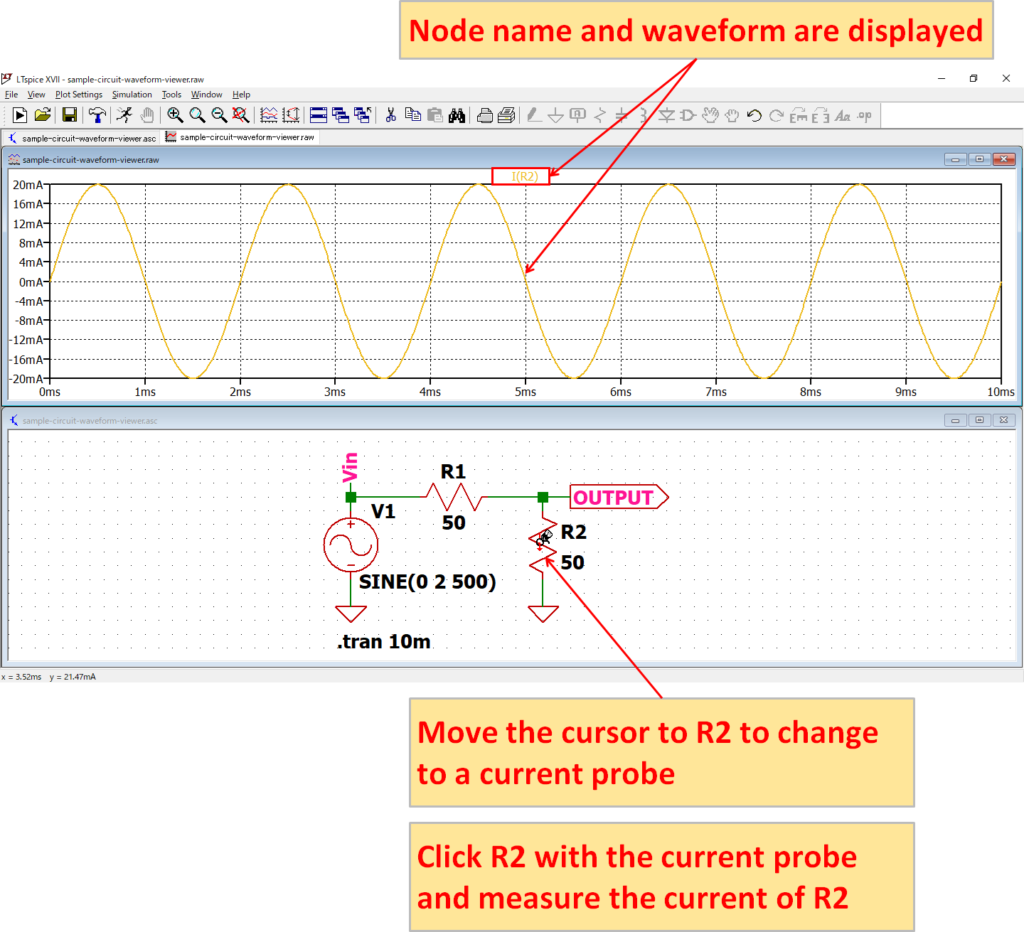
This time, let's display the current waveform flowing through “R2” using a current probe.
When you move the cursor to "R2", it changes to a current probe, so do "left click" of the mouse.
Then, the current waveform and node name of "R2" are displayed on the graph pane.
Power
If you move the cursor to the part of the schematic while holding down the "Alt" key, it will change to a power meter.
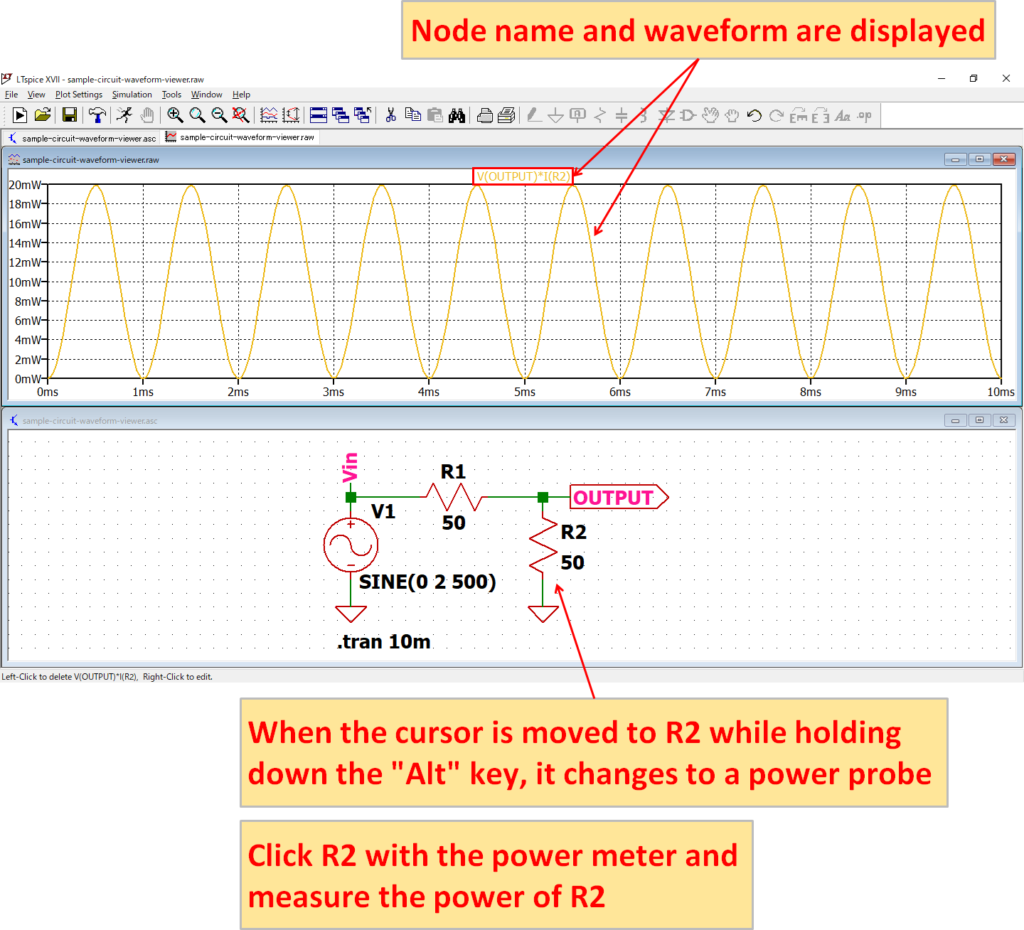
This time, let's display the power waveform of "R2" using a power meter.
When you move the cursor to "R2", it changes to a power meter, so just click "left click" of the mouse.
Then, the power waveform of "R2" and the node name are displayed on the graph pane.
Other waveform display
In addition to the waveform display with the probe, you can also display the waveform with "Visible Traces" or "Add trace".
Visible Traces
In Visible Traces, you can display the waveform by selecting the node name.
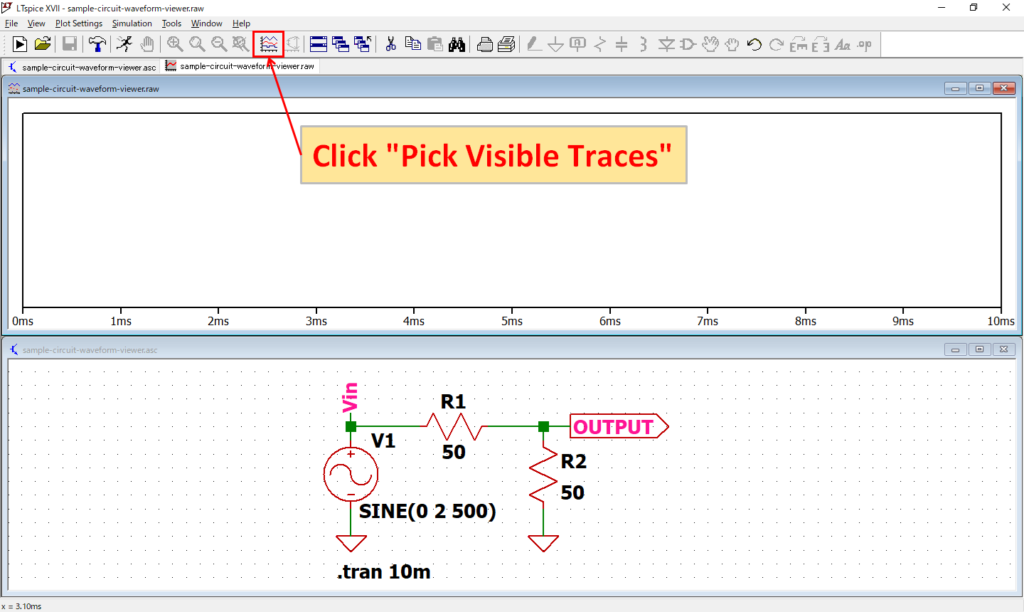
Activate the graph pane and click "Pick Visible Traces" on the toolbar.
(It is OK to activate the graph pane and click "Plot Settings"-"Visible Traces" in the menu bar.)
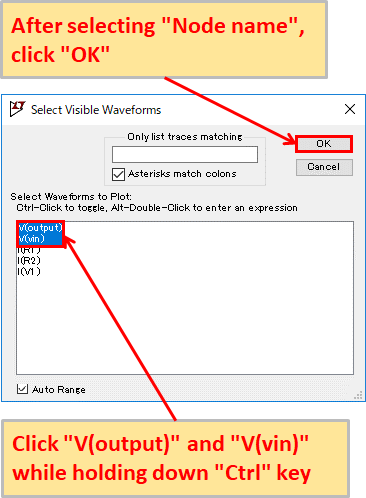
"Select Visible Waveforms" will be displayed, so select the node name for which you want to display the waveform.
Since "V (output)" and "V (vin)" are displayed this time, click "V (output)" and "V (vin)" while holding down the "Ctrl key".
Click "OK" after selecting the node name.
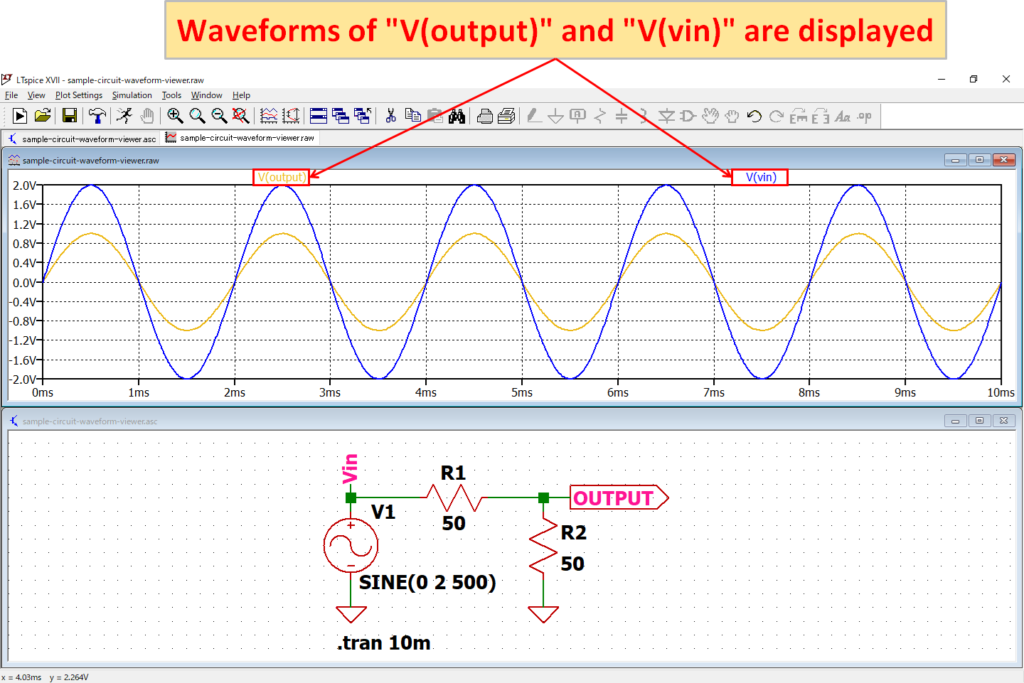
The waveform graphs and node names of "V (output)" and "V (vin)" are displayed on the graph pane.
Add trace
In "Add trace", the waveform can be displayed by selecting the node name in the same way as "Visible Traces", and you can enter a calculation formula.
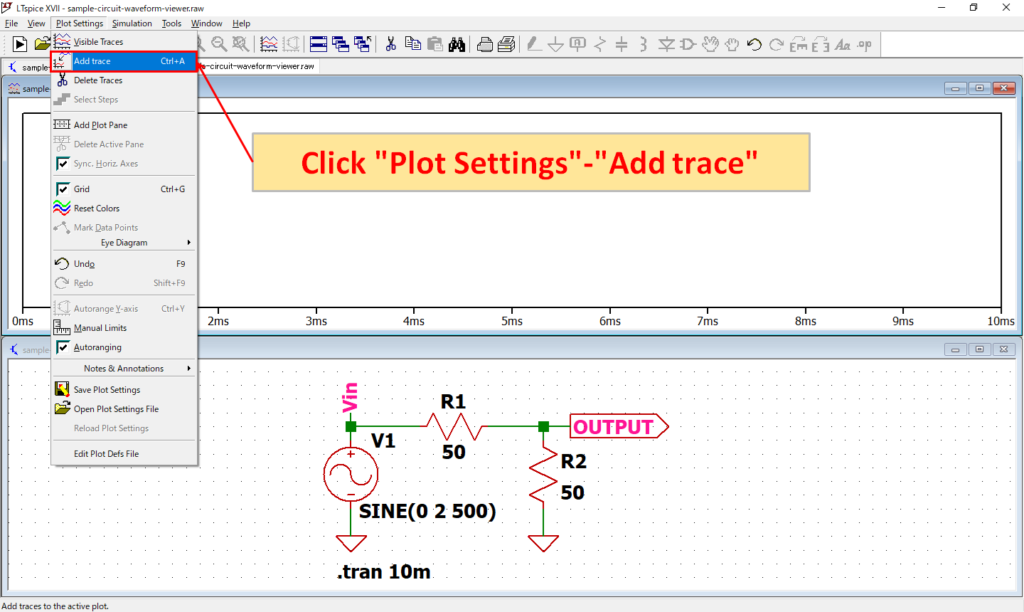
Activate the graph pane and click "Plot Settings"-"Add Trace" on the menu bar.
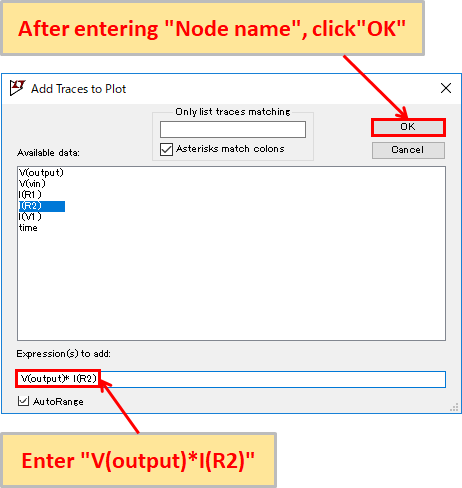
"Add Traces to Plot" is displayed. Select the node name for which you want to display the waveform. You can also enter a calculation formula.
This time, input "V (output) * I (R2)" and display the power waveform of R2. Click "OK" after entering.
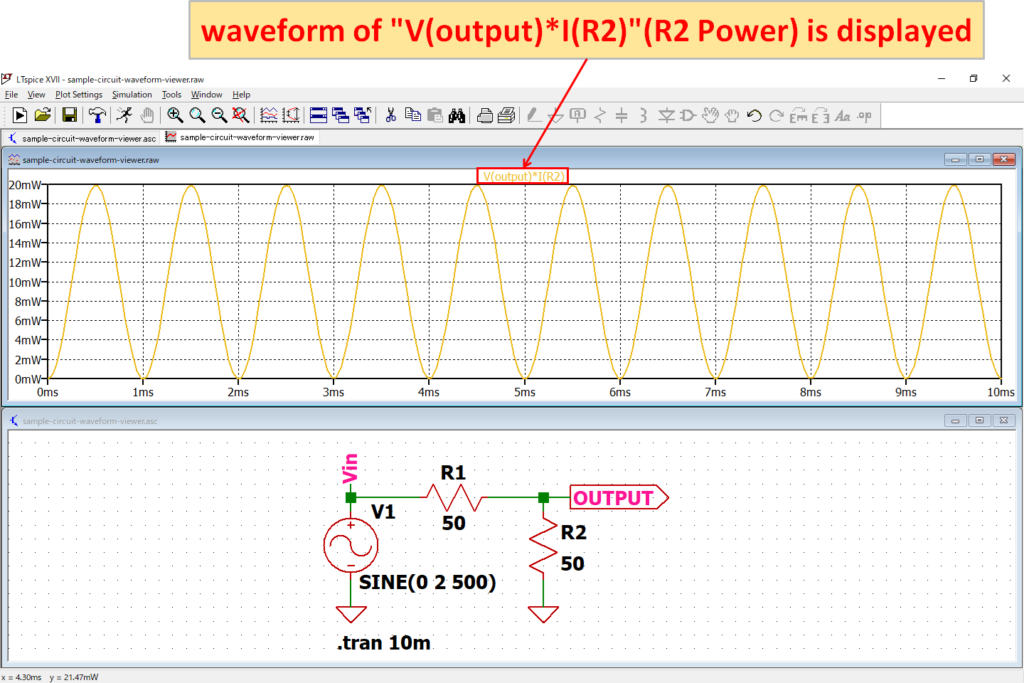
The power waveform of "V (output) * I (R2)" (power of R2) and the node name are displayed on the graph pane.
Waveform scaling
You can zoom in / out the waveform by setting commands on the toolbar or setting the scale of the graph.
Zoom to Rectangle
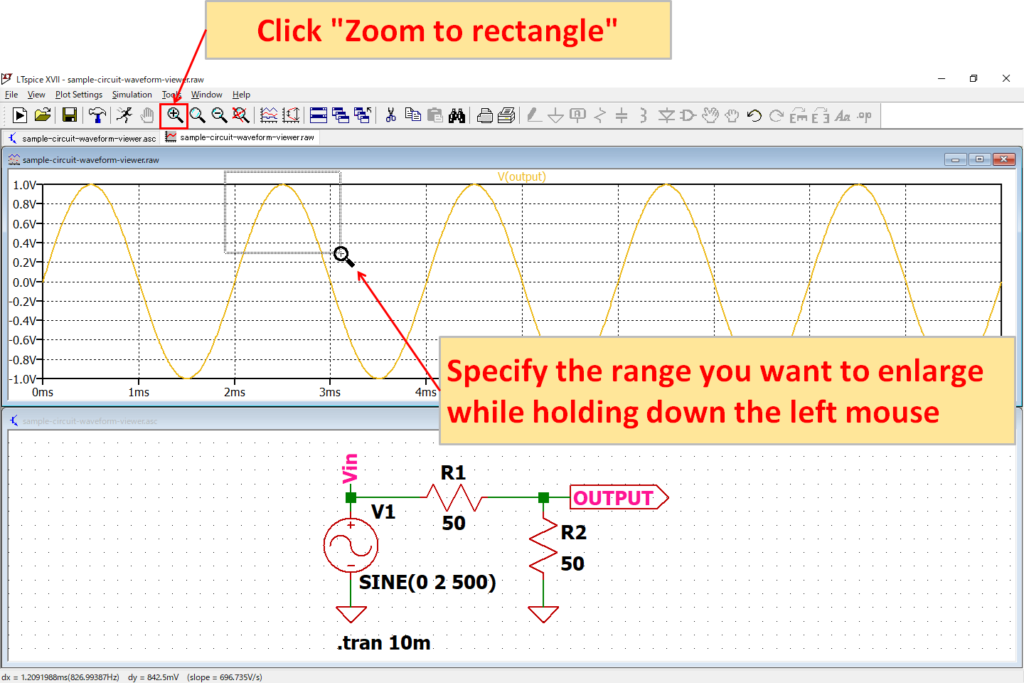
Activate the graph pane, click "Zoom to rectangle", and while holding down the left mouse button, specify the area you want to enlarge.
(It is OK to activate the graph pane and click "View"-"Zoom Area" on the menu bar.)
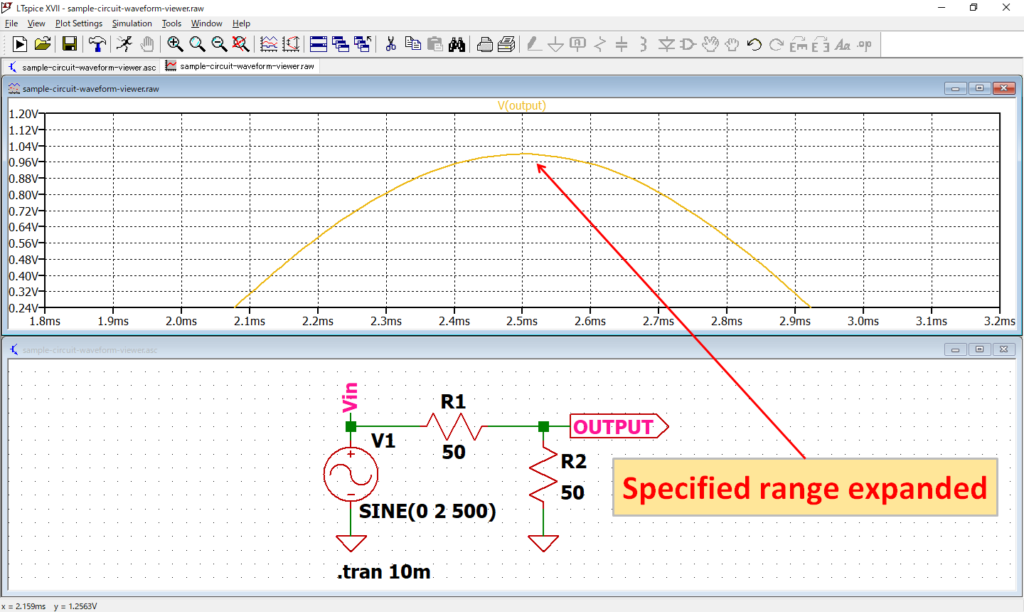
The specified range is expanded as shown above.
Pan
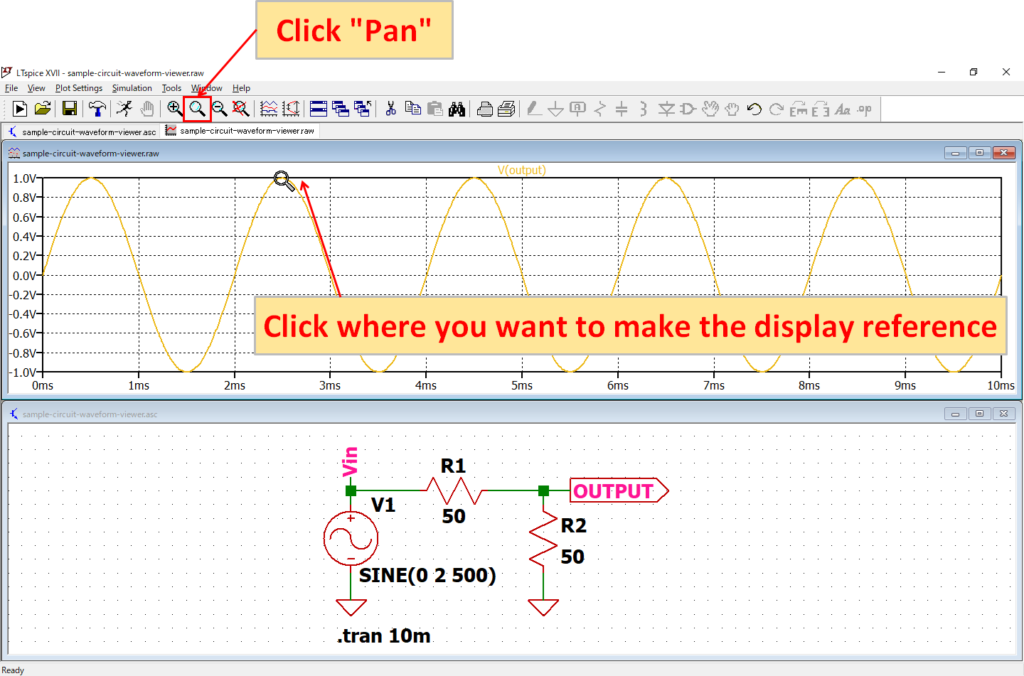
Activate the graph pane, click "Pan", and click the place you want to use as the reference of the display.
(It is OK to activate the graph pane and click "View"-"Pan" on the menu bar.)
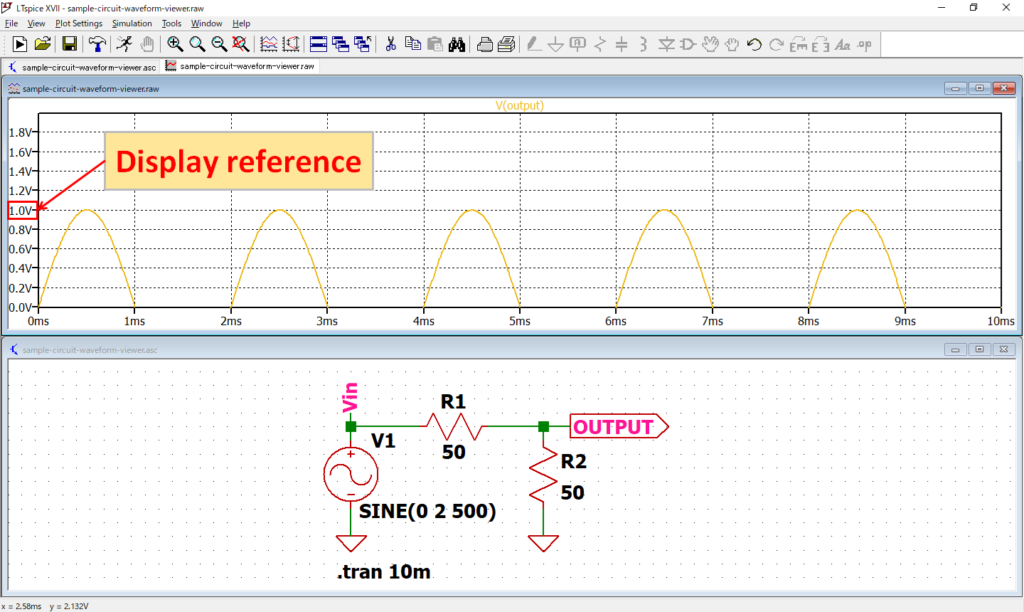
As shown above, the point clicked with the mouse is the center of the vertical axis(Y-axis).
Zoom back
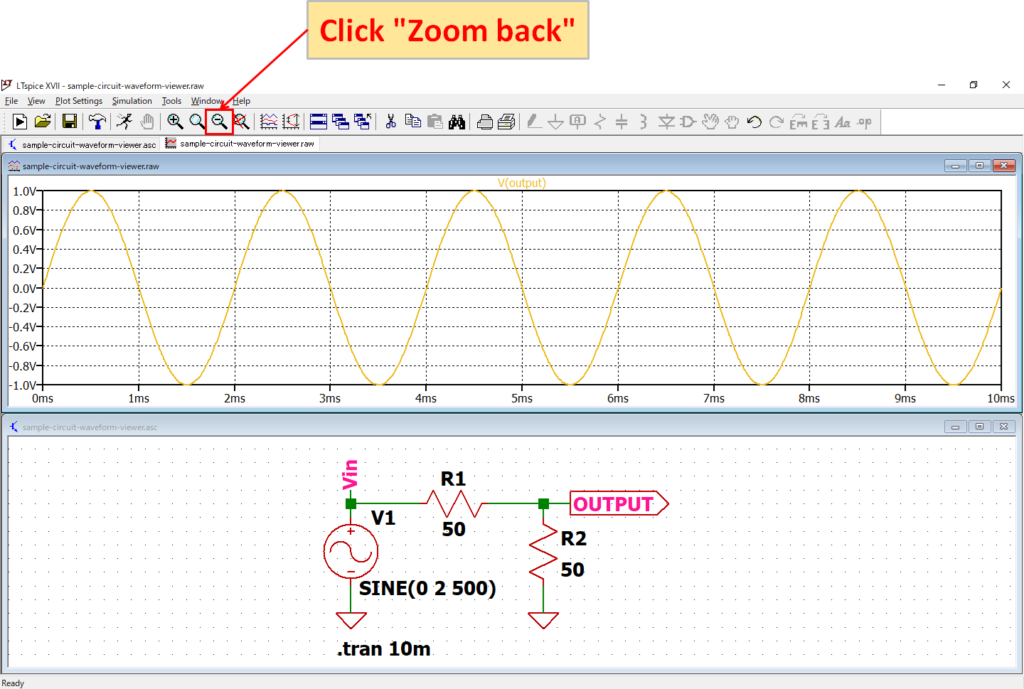
Activate the graph pane and click "Zoom back".
(It is OK to activate the graph pane and click "View"-"Zoom back" on the menu bar.)
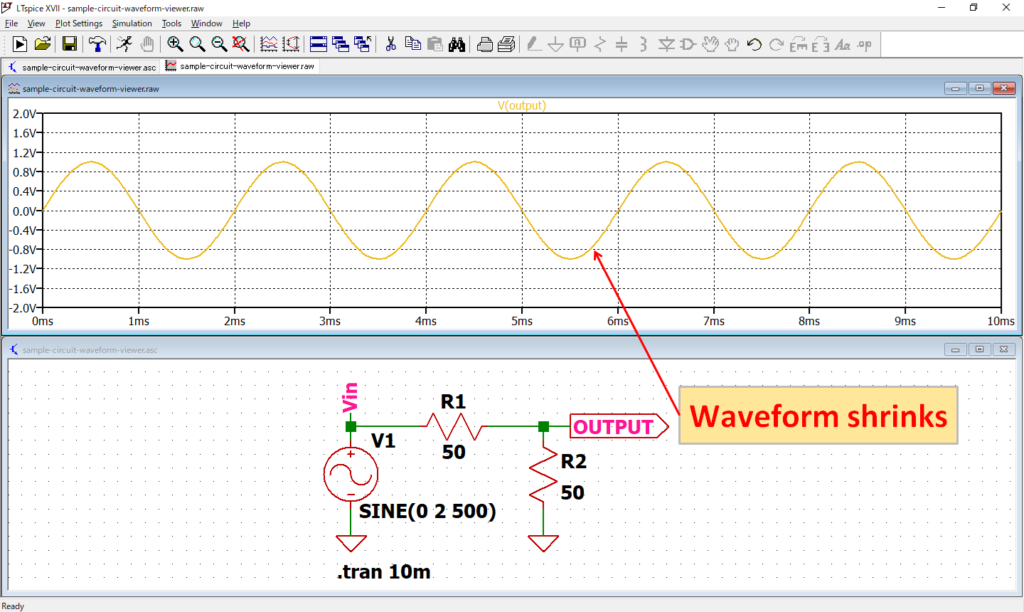
The waveform is reduced as shown above.
Zoom to extents
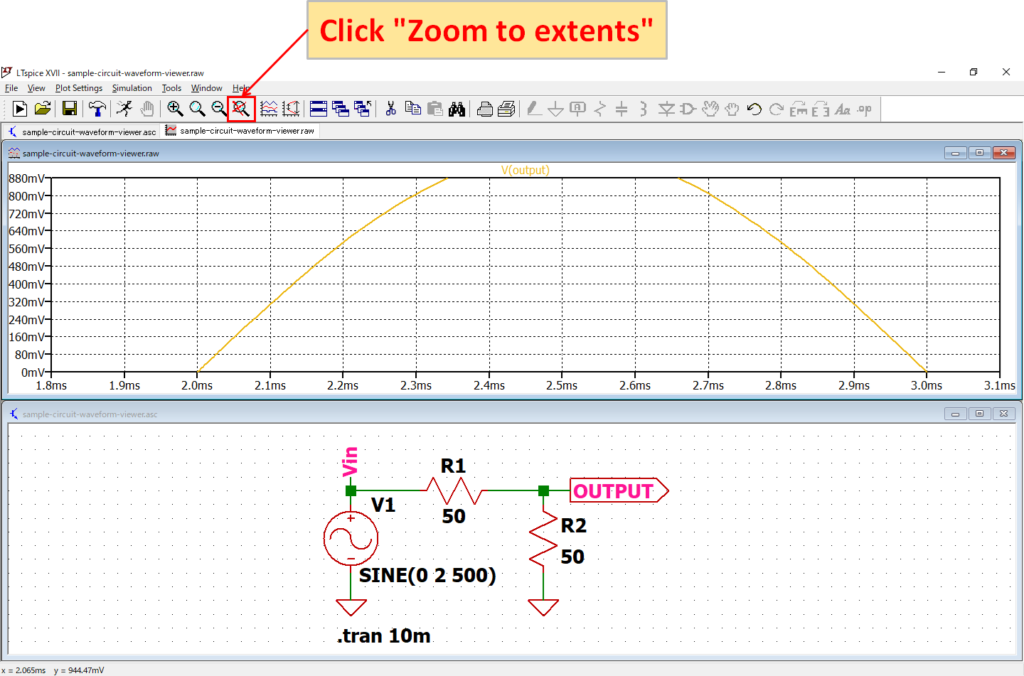
Activate the graph pane and click "Zoom to extents".
(It is OK to activate the graph pane and click "View"-"Zoom to Fit" on the menu bar.)
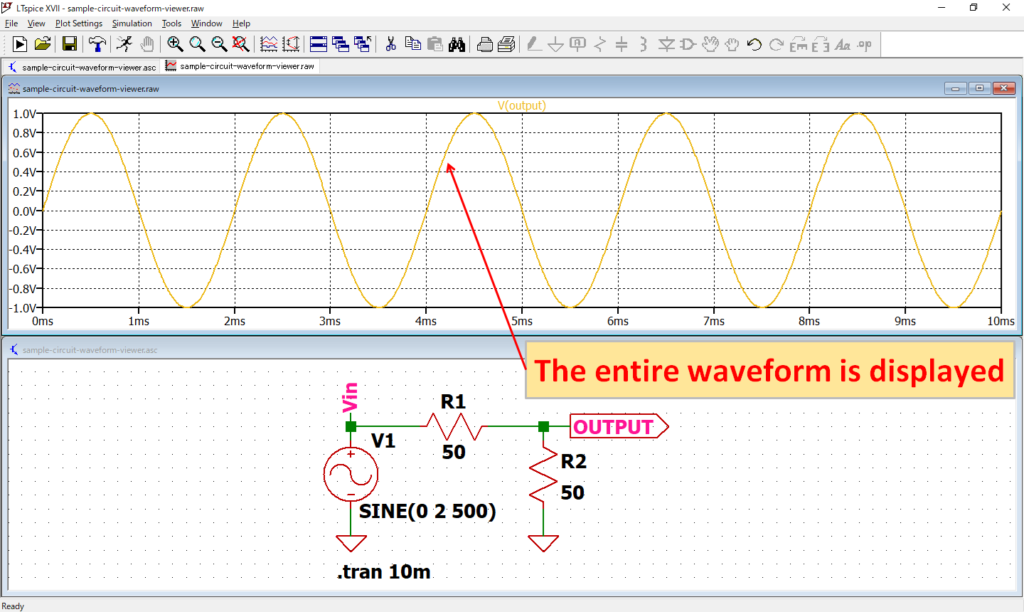
The entire waveform will be displayed as shown above.
Vertical Axis(Y-Axis)
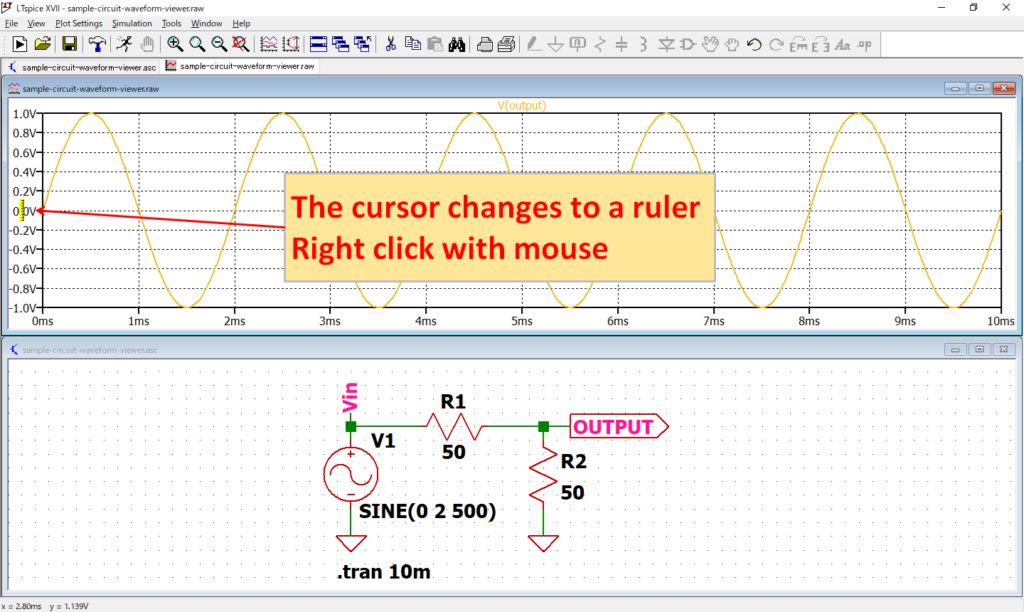
When you move the cursor to the vertical axis(Y-axis), the cursor changes to a ruler, so you can right click of the mouse.
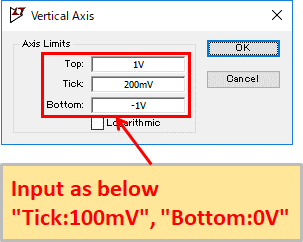
The “Vertical Axis” screen appears, so you can set the vertical axis(Y-axis) scale arbitrarily.
This time, let's try to input "Tick: 100mV", "Bottom: 0V".
- Top:Maximum value of scale
- Tick:Interval value of scale
- Bottom:Minimum value of scale
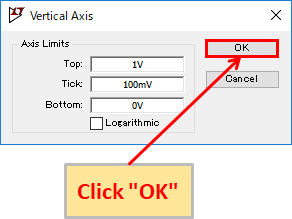
Click "OK" after entering.
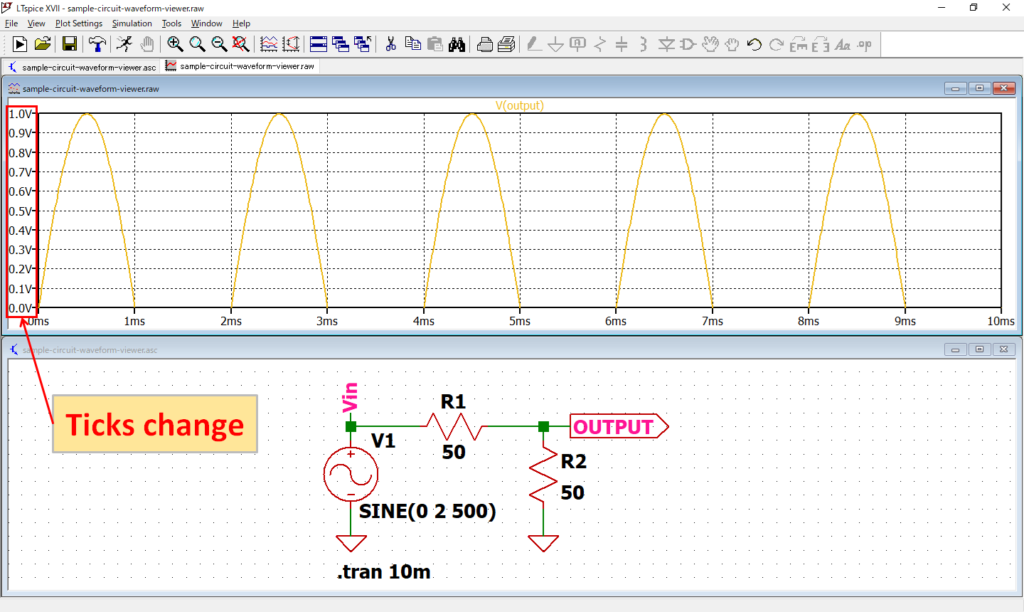
As shown above, the vertical axis scale changes, and the waveform display changes to match the scale.
Horizontal Axis(X-Axis)
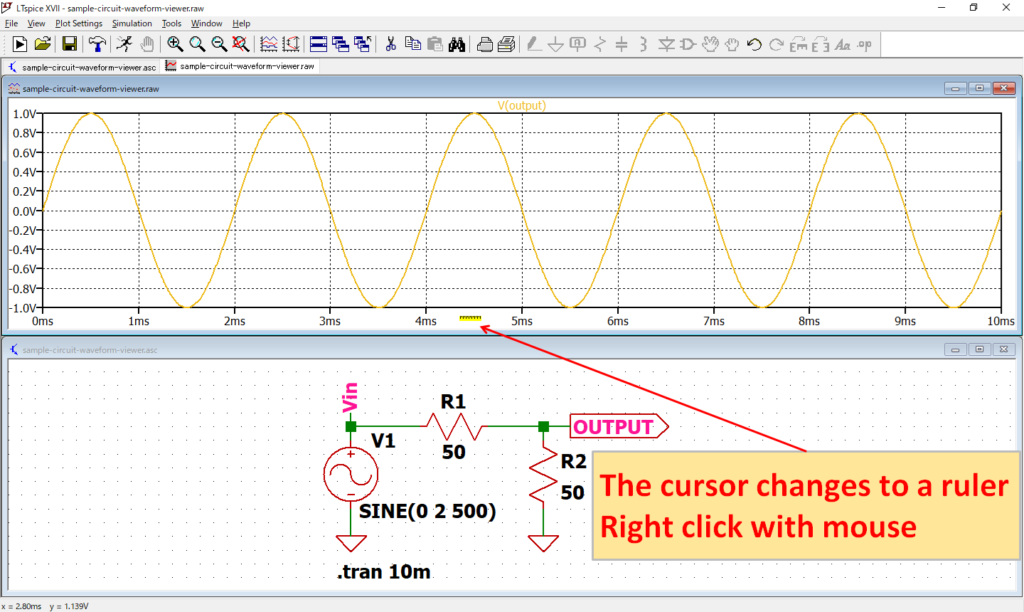
When you move the cursor to the horizontal axis(X-axis), the cursor changes to a ruler, so you can right click of the mouse.
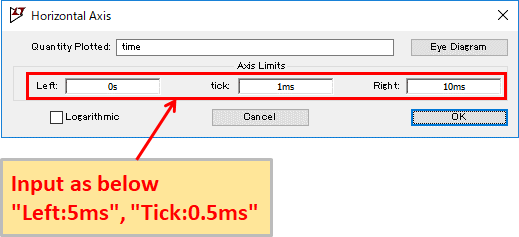
Since the "Horizontal Axis" screen appears, you can set the scale of horizontal axis(X-axis) arbitrarily.
This time, let's try to input "Left: 5ms" and "Tick: 0.5ms".
- Left:Minimum value of scale
- Tick:Interval value of scale
- Right:Maximum value of scale
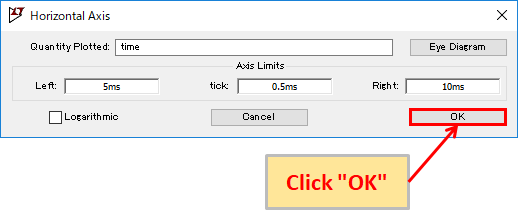
Click "OK" after entering.
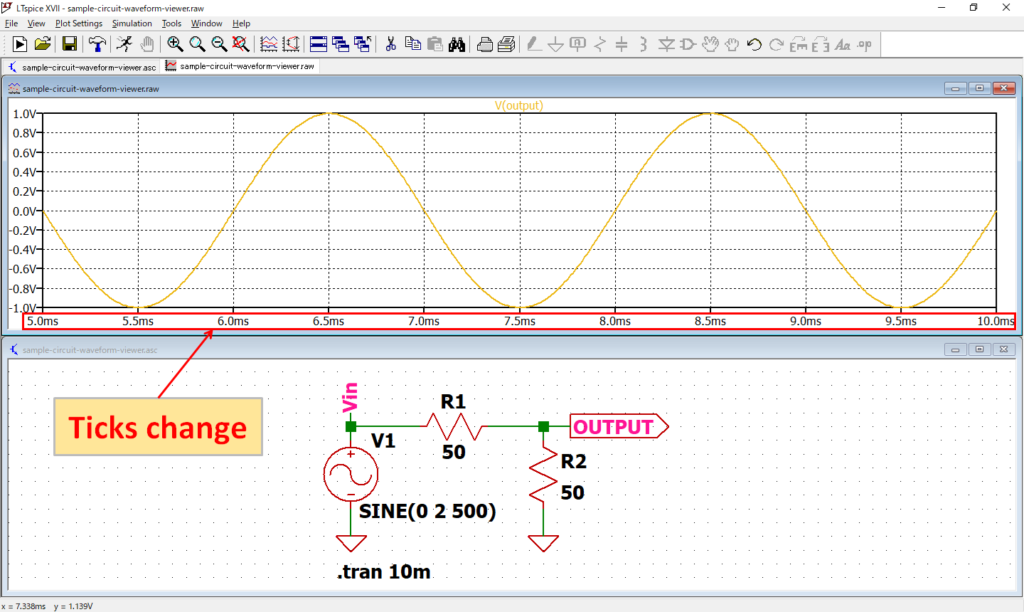
As shown above, the scale of the horizontal axis is changed, and the waveform display changes according to the scale.
waveform delete
You can delete the waveform with the "Expression Editor" or “Cut” on the toolbar.
Expression Editor
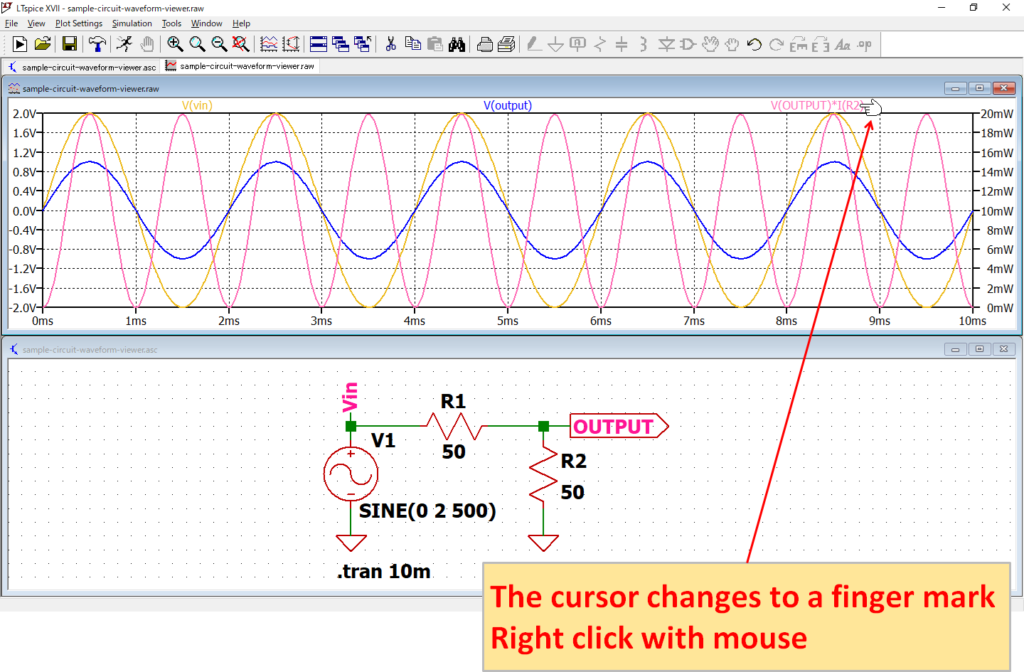
When you move the cursor to the node name on the graph pane, the cursor changes to a finger mark, so right click of mouse.
This time, let's delete the power waveform of "V(OUTPUT)*I(R2)", so I do a "right click" of the mouse with the node name of "V(OUTPUT)*I(R2)".
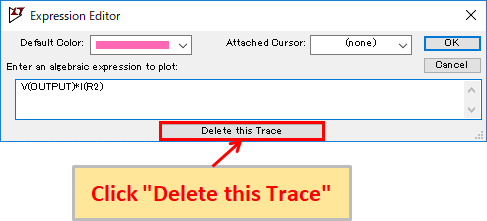
The "Expression Editor" will appear. Click "Delete this Trace".
If you check the graph pane, you can see that the power waveform of "V(OUTPUT)*I(R2)" has been deleted.
Cut
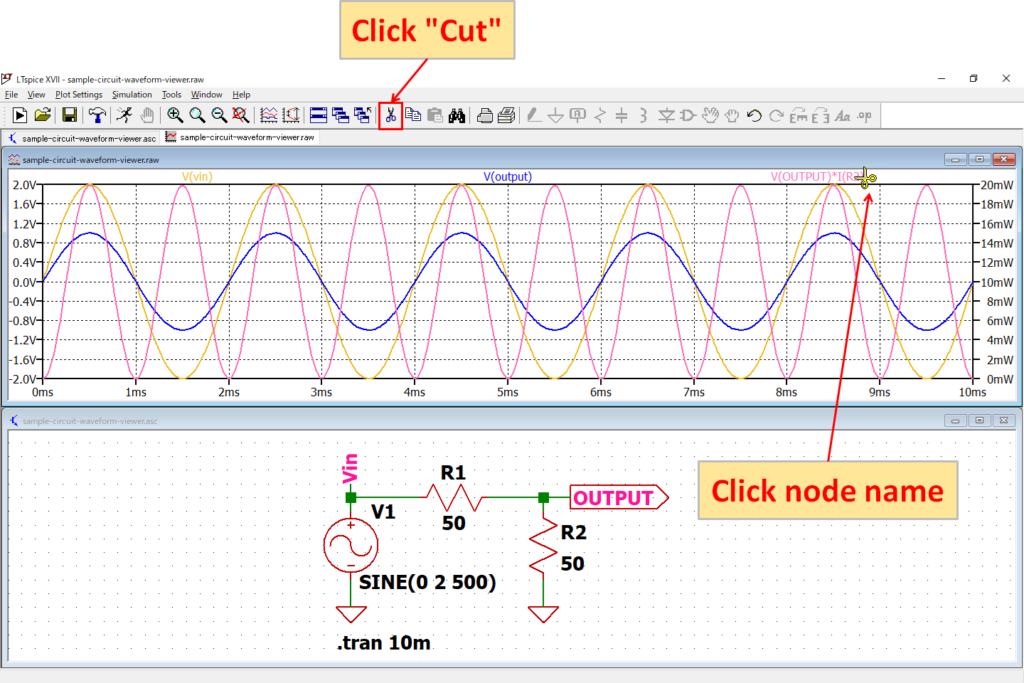
Activate the graph pane and click "Cut" on the toolbar.
(It is OK to activate the graph pane and click "Plot Settings"-"Delete Traces" on the menu bar.)
After that, move the scissors mark(cursor) to the node name you want to delete and "left click" of the mouse.
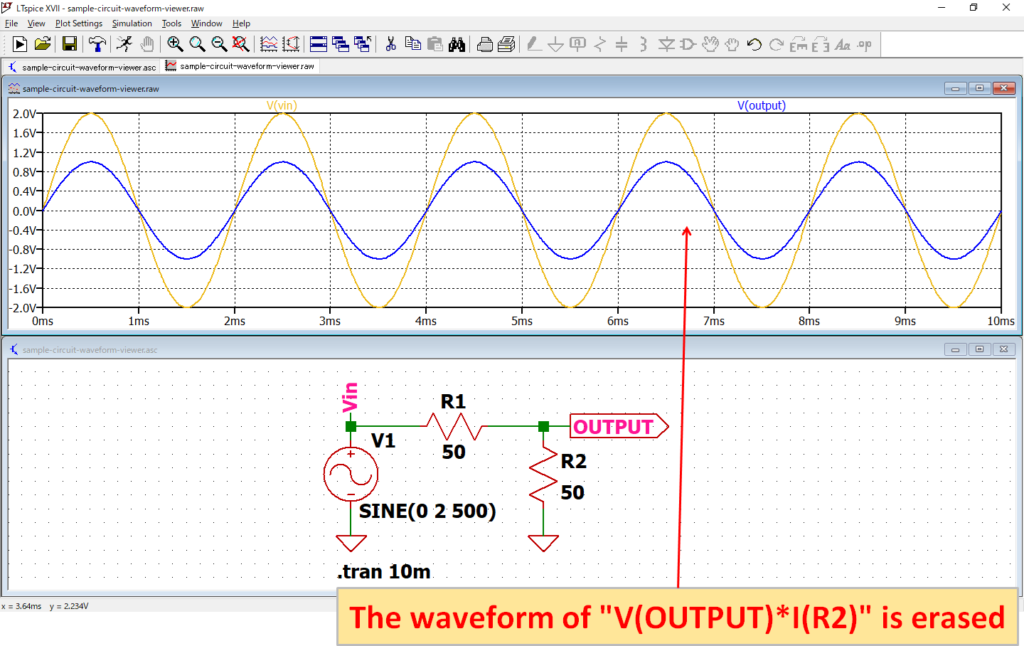
This time, delete the power waveform of "V(OUTPUT)*I(R2)", so "left click" of the mouse with the node name of "V(OUTPUT)*I(R2).
If you check the graph pane, you can see that the power waveform of "V(OUTPUT)*I(R2) has been deleted.
Measurement with Cursor
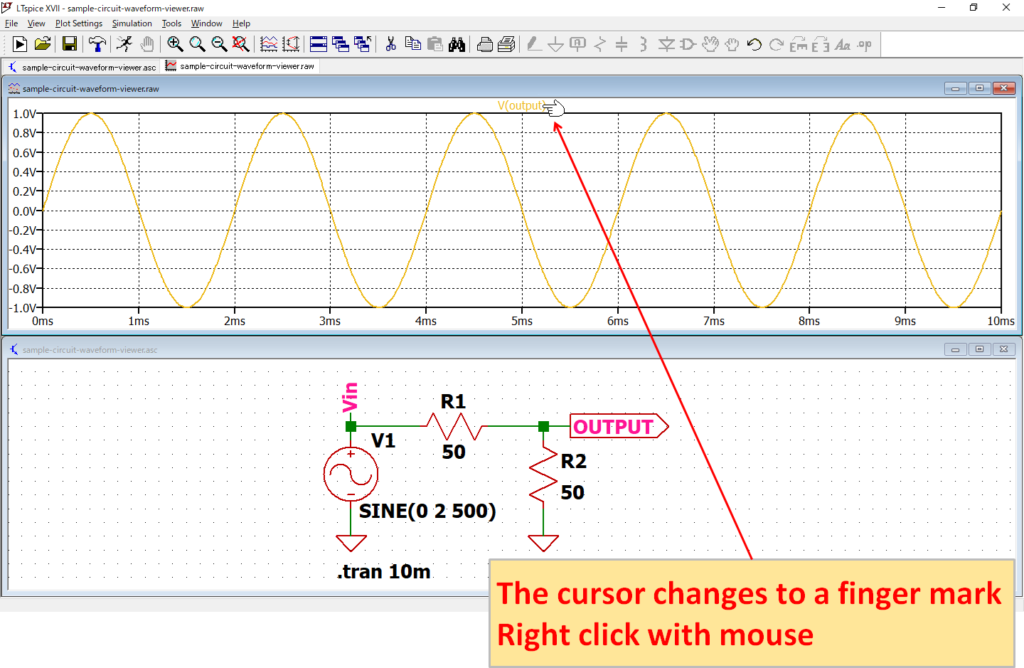
When you move the mouse cursor to the node name on the graph pane, the mouse cursor changes to a finger mark, so "right click" of the mouse.
This time, use the cursor to measure the waveform of V(OUTPUT), so "right click" of the mouse with the node name of V(OUTPUT).
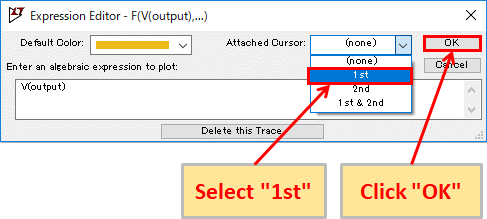
You can select the cursor from "1st", "2nd" or "1st & 2nd" in "Attached Cursor".
First, select the "1st" cursor and click "OK".
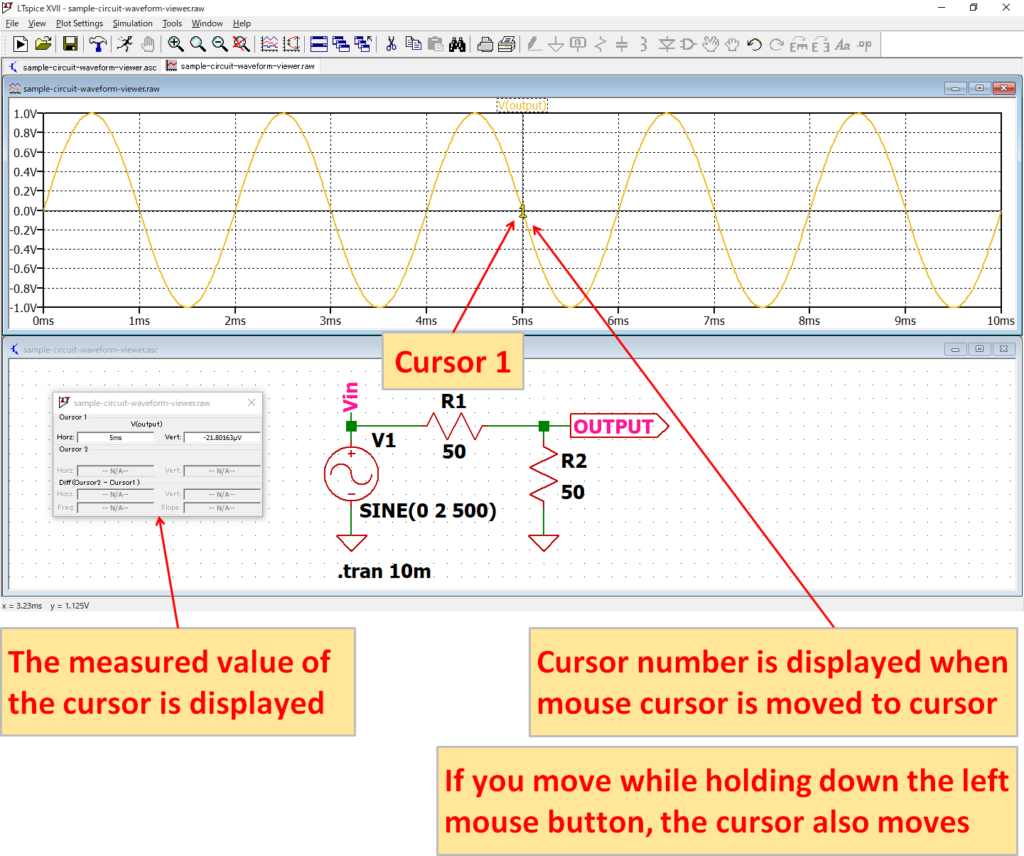
Although it is difficult to see, the cursor is displayed on the graph pane. When you move the mouse cursor to the cursor, the cursor number "1" is displayed.
Also, "the cursor screen" is displayed. Since the selected cursor is "1st", only the measured value of cursor 1 is displayed.
To move the cursor, when the cursor number appears, hold down the mouse "left click" and move the cursor together.
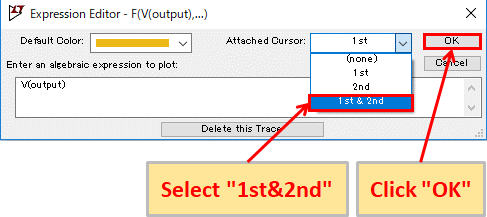
Next, select the "1st & 2nd" cursor and click "OK".
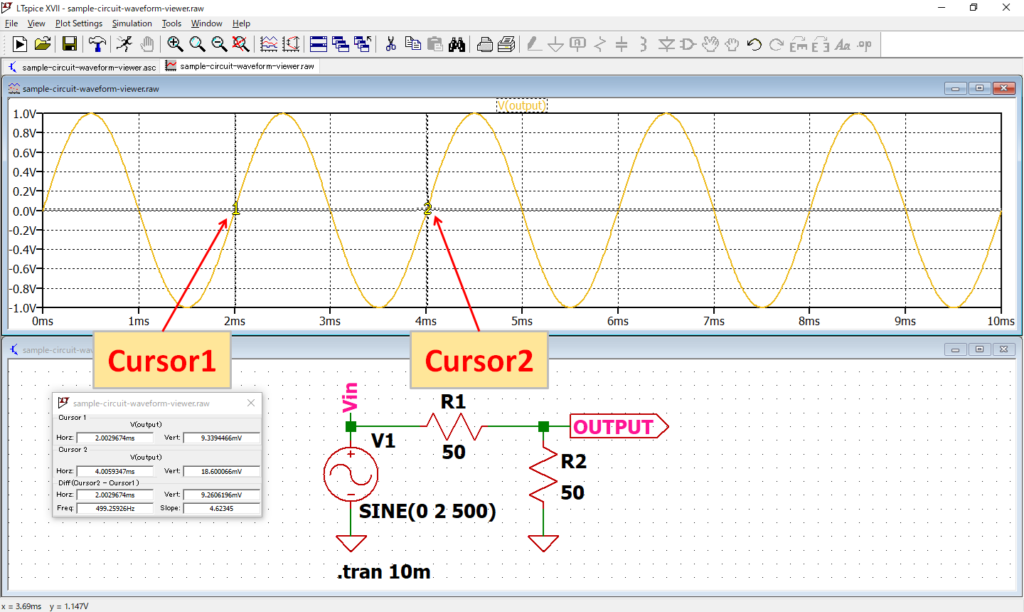
Since the cursor of "1st & 2nd" is selected, two cursors are displayed on the graph pane. The difference measurement of two cursors will be displayed on "the cursor screen".
Moreover, although two cursors of "1st" and "2nd" were selected for one waveform this time, it is also possible to select "1st" and "2nd" respectively for two different waveforms. . Of course, you can also make a difference measurement.
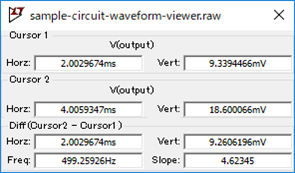
- Cursor1
- Horz: Horizontal axis(X-axis) of cursor 1
- Vert: Vertical axis(Y-axis) of cursor 1
- Cursor2
- Horz: Horizontal axis(X-axis) of cursor 2
- Vert: Vertical axis(Y-axis) of cursor 2
- Diff(Cursor2 – Cursor1)
- Horz:Difference of (cursor 2-cursor 1) of horizontal axis(X-axis)
- Vert:Difference of (cursor 2-cursor 1) of vertical axis(Y-axis)
- Freq:Frequency of (cursor 2-cursor 1)
- Slope:Slope of (Cursor 2-Cursor 1)
However, since it is a measurement that moves the cursor, it is not suitable for accurate and accurate measurement to set it to a good number.
(You can not move the cursor by entering numbers on "the cursor screen".)
If you want to measure more easily and accurately, it is better to use the ".measure" command.