LTspice-Monte Carlo Analysis(mc)
In this article, we will explain in detail the monte carlo analysis(mc) method in LTspice.
Monte Carlo analysis analyzes the effects of errors due to electronic circuit parts.
It is performed simultaneously with transient analysis, AC analysis, DC sweep analysis, etc.
For the types of analysis, please see the following article.

Prepare a schematic
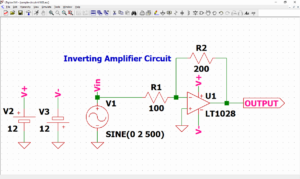
First, prepare a schematic for monte carlo analysis with LTspice.

Perform monte carlo analysis using the schematic in the following article. If you have not drawn a schematic with LTspice, we recommend that you draw a schematic before analysis.
In addition, since the schematic was prepared here, if you want to start analysis immediately, download it by clicking the link below.
Signal source setting
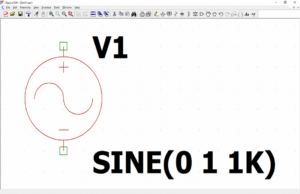
We have already set the signal source in the article of "How to Draw a Schematic", but let's check it just in case.
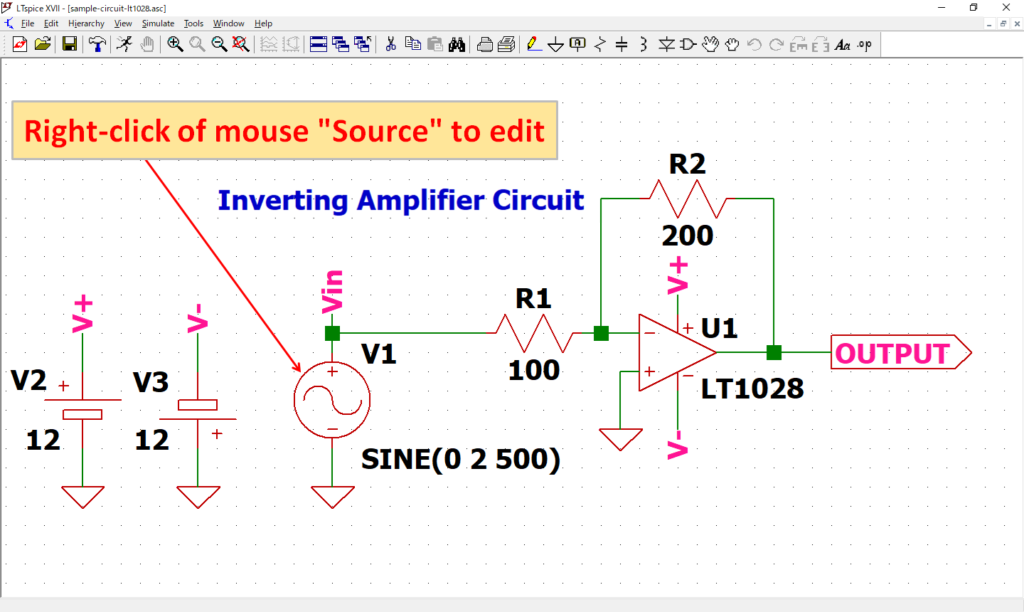
Open the “Independent Voltage Source” screen by “right-clicking” the signal source V1 of the schematic with the mouse.
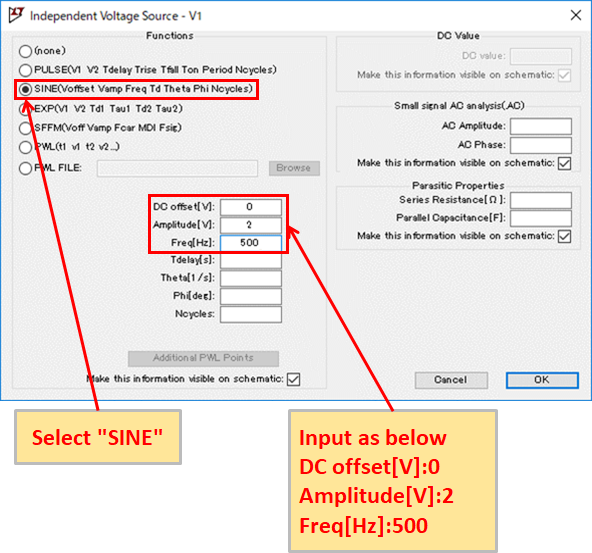
Check that SINE is selected and DC offset [V]: 0, Amplitude [V]: 2, Freq [Hz]: 500 is input.
Refer to the following article for the detailed setting method of the signal source.
Monte Carlo Analysis(mc)
In Monte Carlo analysis, it is necessary to set the part which changes the parameter by the error. This time, set the feedback resistor R2 of the op-amp.
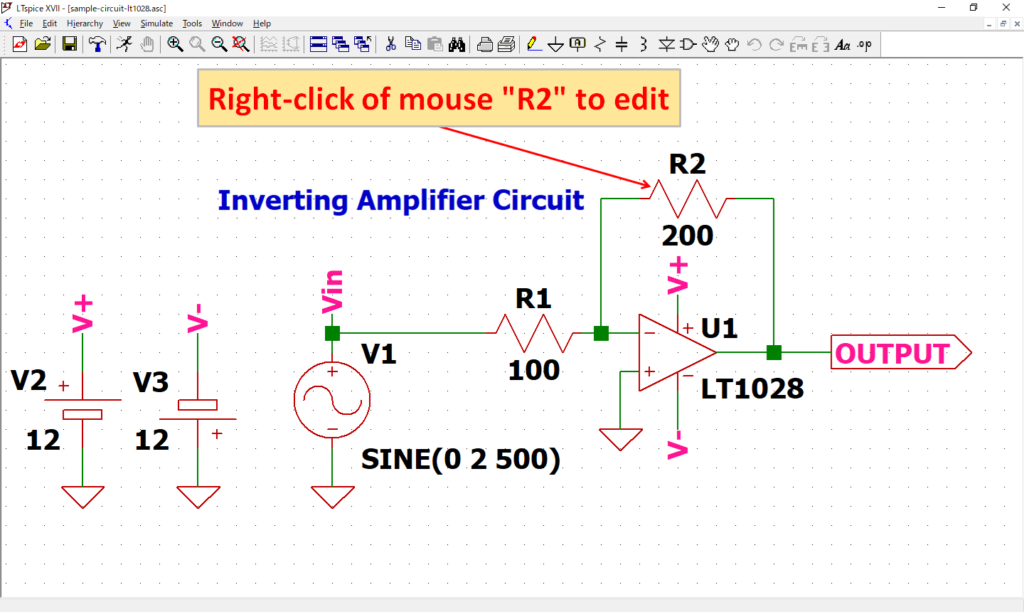
Open the edit screen of resistance R2 by “right clicking” the resistance R2 of the schematic with the mouse.
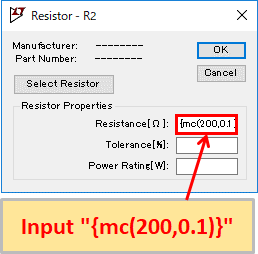
Enter {mc (200, 0.1)} for the Resistance[Ω]. The resistance value of R2 is set to perform Monte Carlo analysis with an error of 10%.
(In order to make it easy to understand the variation of the error in the analysis results, it was set with an error of 10%.)
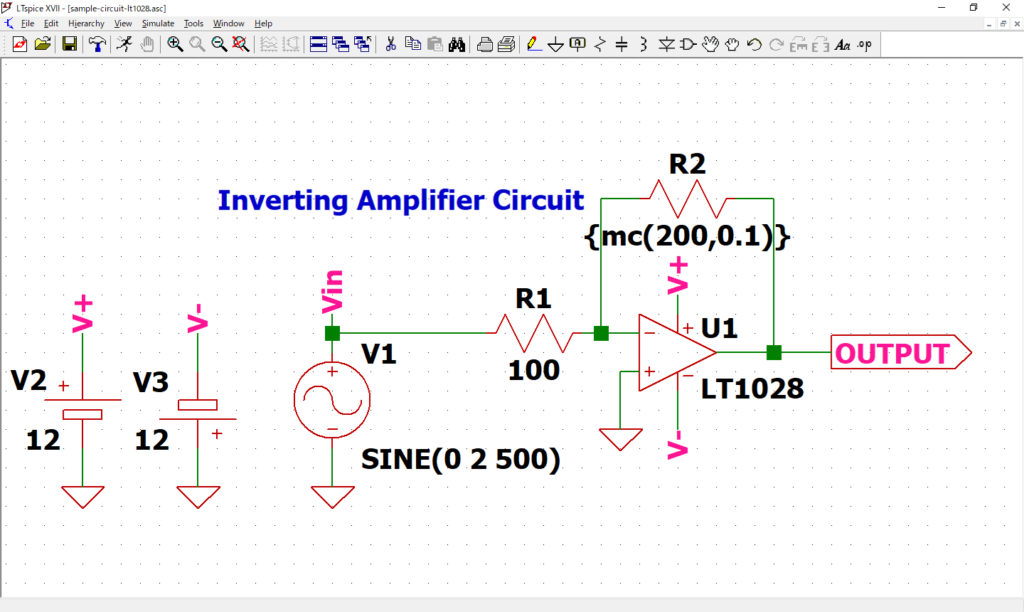
Make sure that the parameter of R2 is "{mc (200, 0.1)}".
Transient Analysis(.tran) Setting
Monte carlo analysis is performed simultaneously with transient analysis, AC analysis, DC sweep analysis and so on. This time, we set up transient analysis to be performed simultaneously with monte carlo analysis.
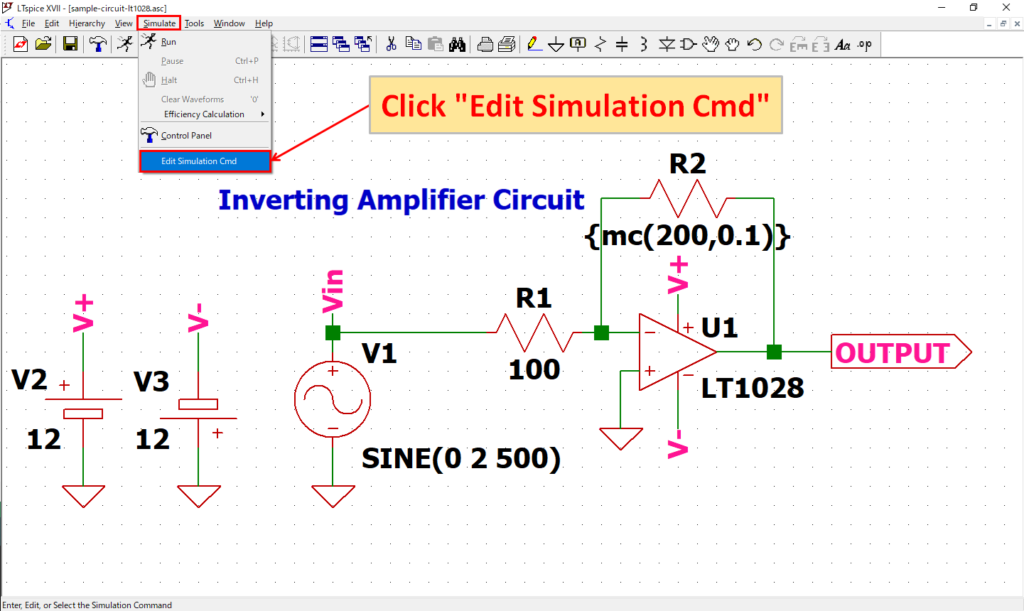
Click “Simulate”-“Edit Simulation Cmd” in the menu bar to open the “Edit Simulation Command” screen.
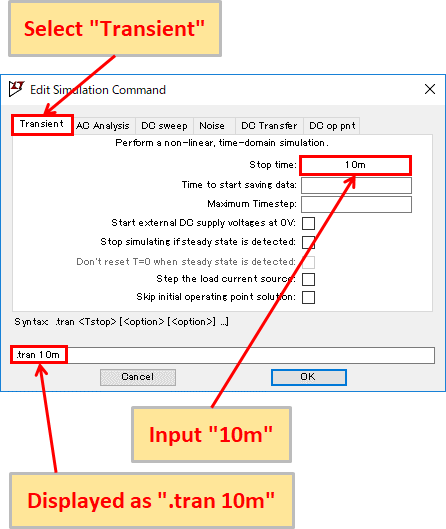
Select “Transient” and enter “10 m” for Stop time. You should now see “.tran 10m” at the bottom of the screen.
Now, it is set to perform transient analysis for 10msec.
LTspice can use auxiliary units other than “m” as shown in the following table.
Of course, it does not matter if you enter “0.01” instead of “10m” without using auxiliary units.
Auxiliary unit of LTspice
| Unit (prefix) | Unit | Multiple |
|---|---|---|
| T | tera | 1012 |
| G | giga | 109 |
| Meg | mega | 106 |
| k | kilo | 103 |
| m | milli | 10-3 |
| u | micro | 10-6 |
| n | nano | 10-9 |
| p | pico | 10-12 |
| f | femto | 10-15 |
Refer to the following article for the detailed setting method of transient analysis.
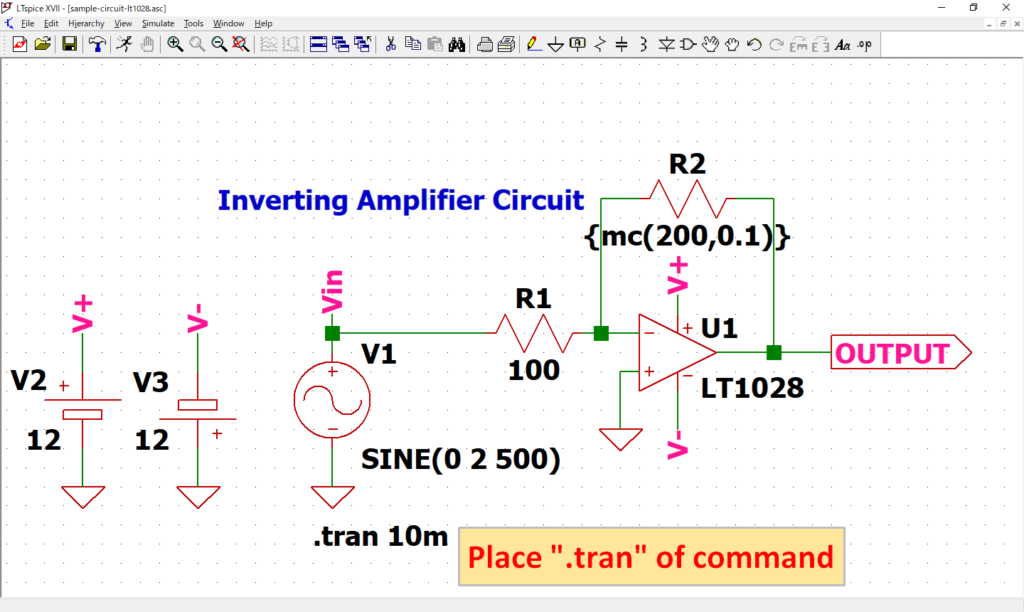
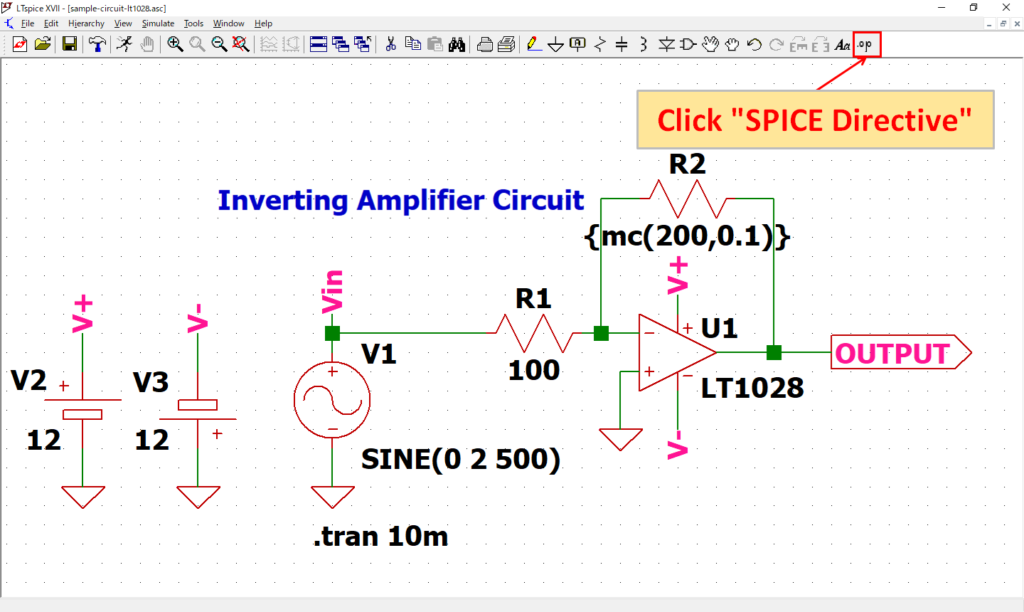
As “.tran 10m” of dot command appear, place it at an appropriate position. In this article, it was placed near source V1.
Although the “.tran” of dot command was created from the screen of “Edit Simulation Command”, it can also be created by “Edit Text on the Schematic”.
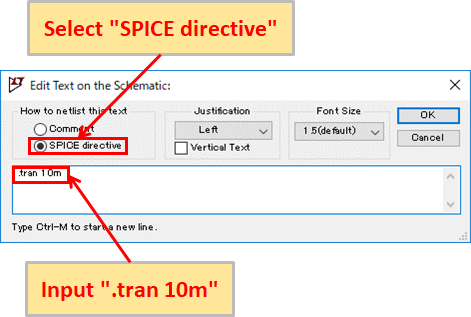
Click “SPICE Directive” on the toolbar to display “Edit Text on the Schematic” screen.
Make sure that the “SPICE directive” is selected, enter the dot command syntax (“.tran 10m” in this case), and click OK to place the created dot command.
Parametric Analysis(.step) Setting
The one-time simulation does not show the effect of part error variation, so multiple simulations are required.
This time, we will set up a parametric analysis that performs 10 simulations.
Click “SPICE Directive” on the toolbar to display “Edit Text on the Schematic” screen.
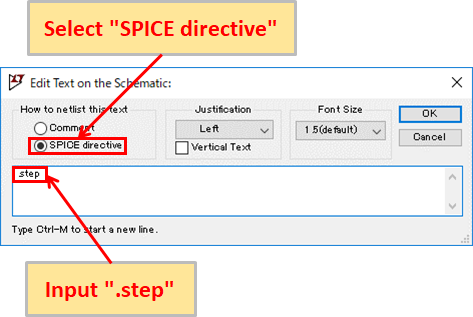
Make sure the “SPICE Directive .step” is selected and enter “.step”.
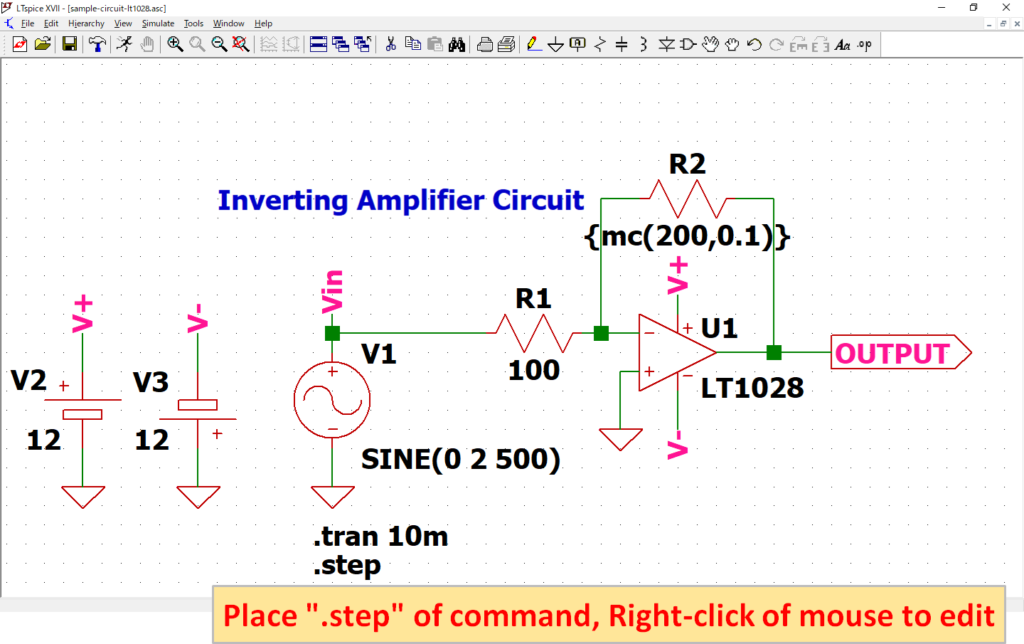
The “.step” of dot command appears, so place it at an appropriate position. In this article, it was placed near source V1.
After placement, right-click “.step” of the mouse to open the “.step Statement Editor” screen.
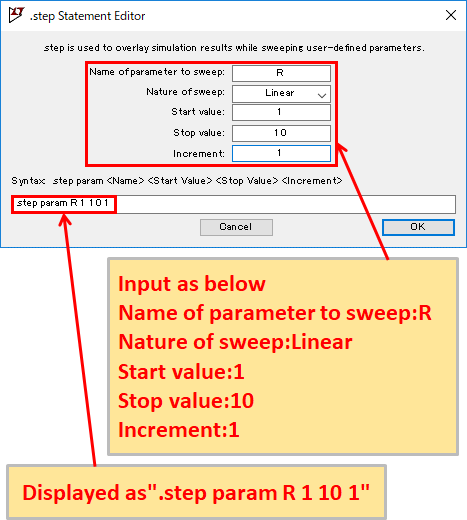
Input Name of parameter to sweep:R, Nature of sweep:Linear, Start value:1, Stop value:10, Increment:1. You should see ".step param R 1 10 1" at the bottom of the screen.
This is the setting for parametric analysis that performs 10 simulations.
Of course, if you know the syntax format, you can also enter it on the "Edit Text on the Schematic" screen.
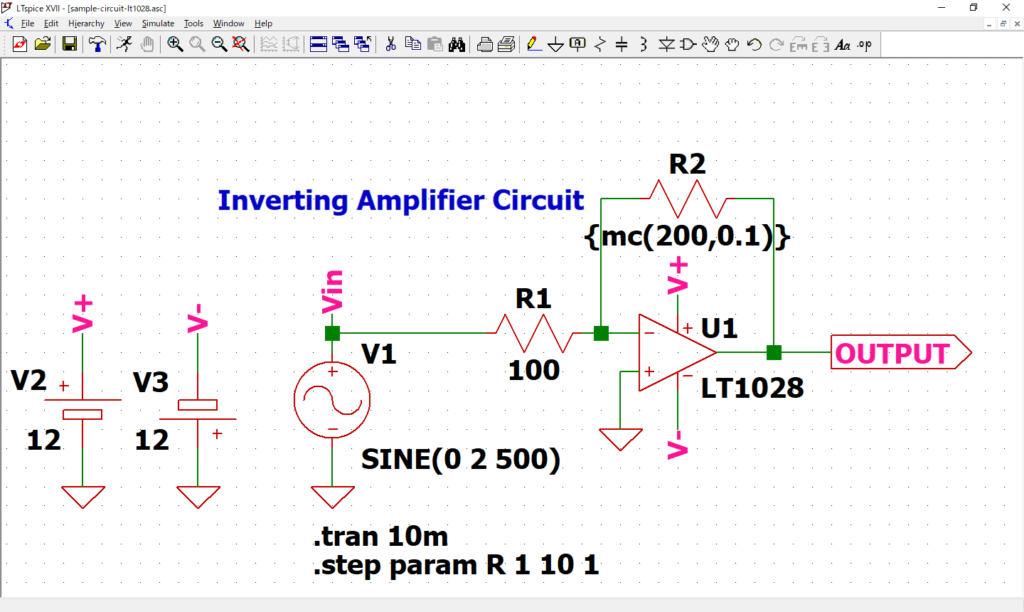
Confirm that “.step” of the dot command is displayed as “.step param R 1 10 1”.
Simulation
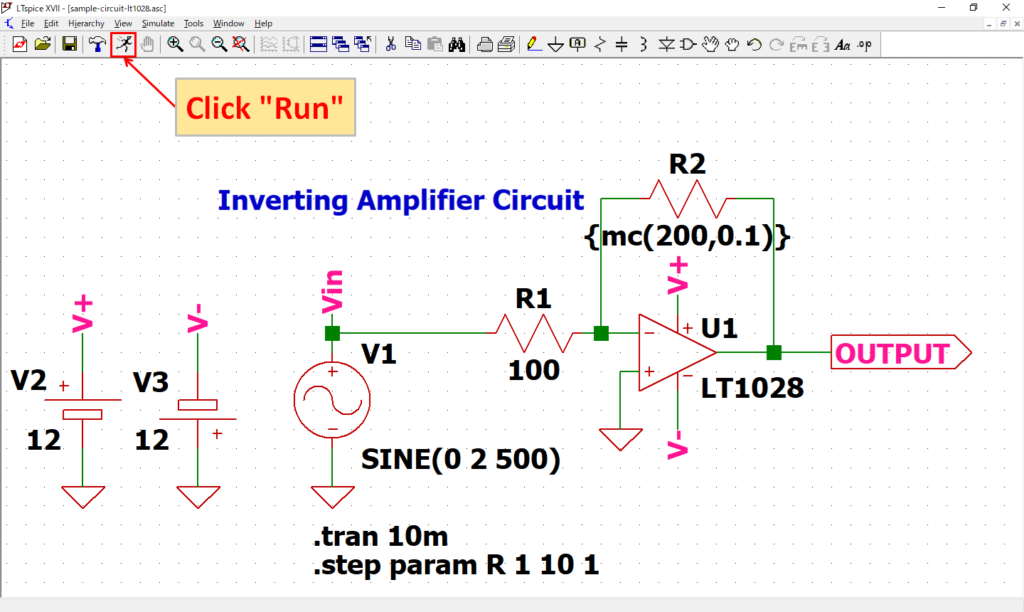
Click “Run” on the toolbar to run the simulation. The simulation time varies depending on the size of the circuit.
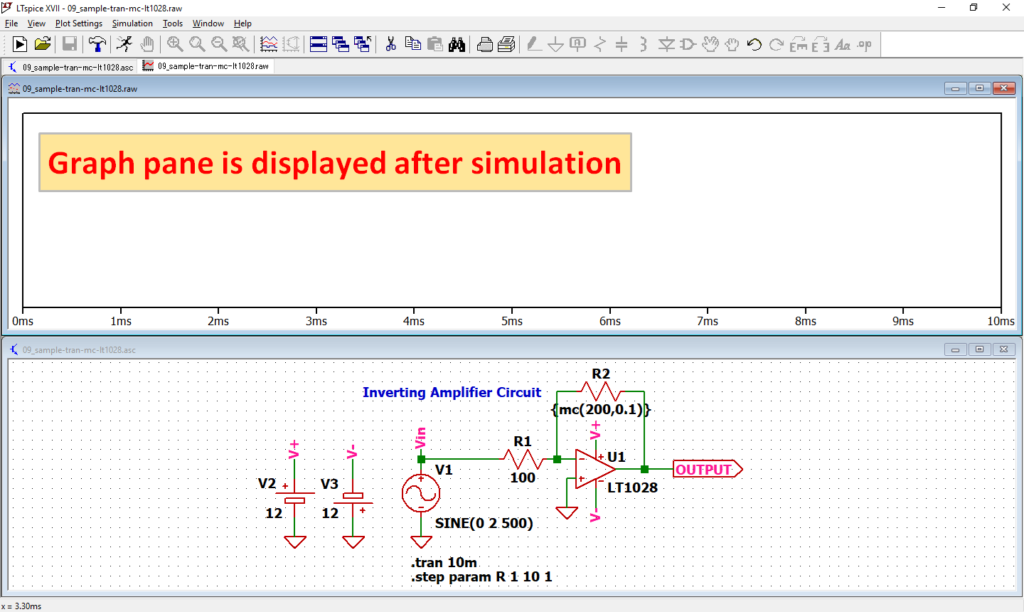
After simulation, the graph pane will appear at the top of the schematic with the default settings of LTspice.
If you want to lay out the schematic editor and graph pane, see the following article, “Display the schematic editor and waveform graph side by side”.
Analysis result
In this article, we would like to easily check the analysis results with the LTspice voltage probe.
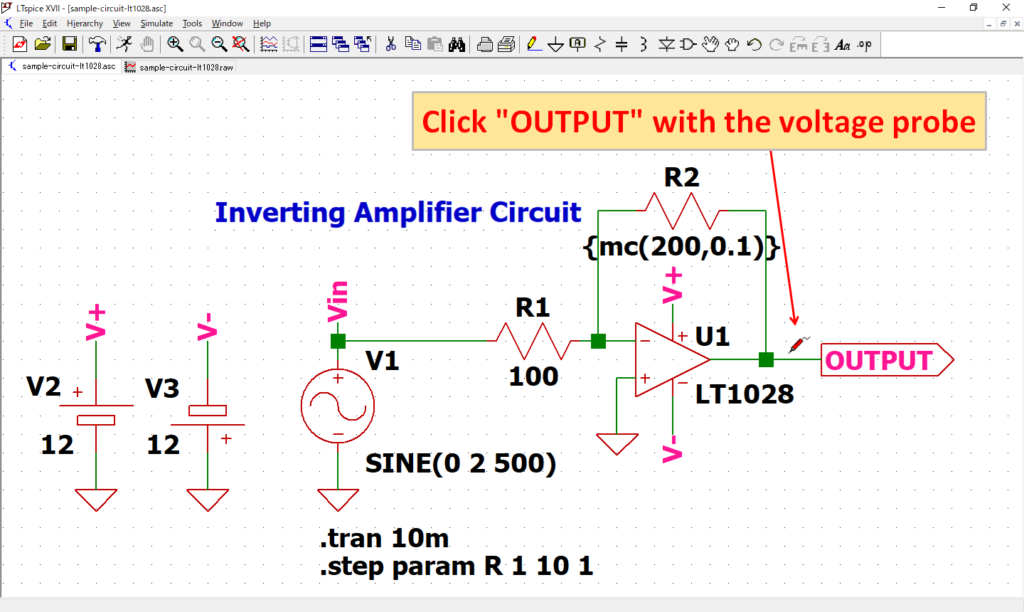
After simulation, when you move the cursor close to the schematic wiring, the cursor changes to “voltage probe”.
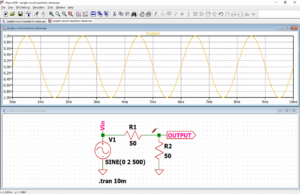
Click “OUTPUT” with the voltage probe.
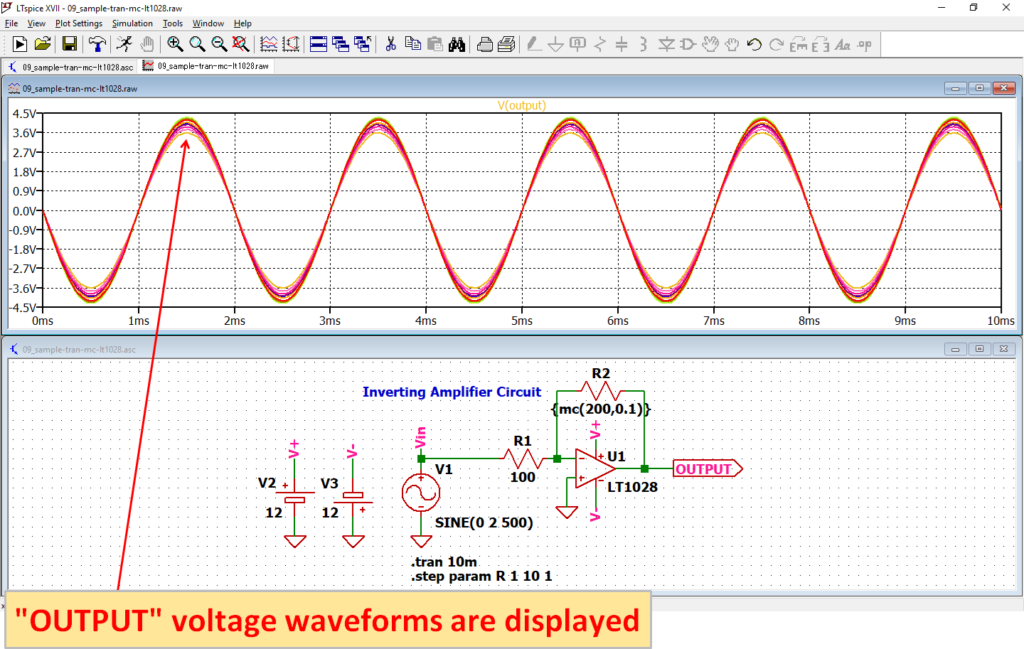
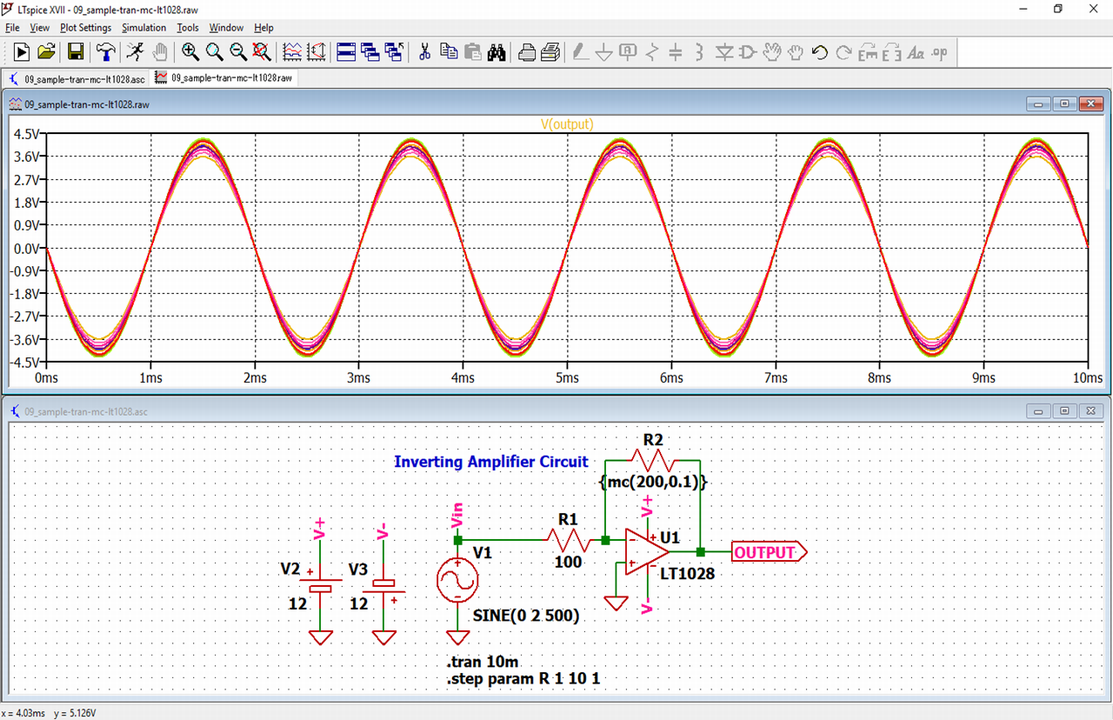
The voltage waveforms of OUTPUT appear on the graph pane.
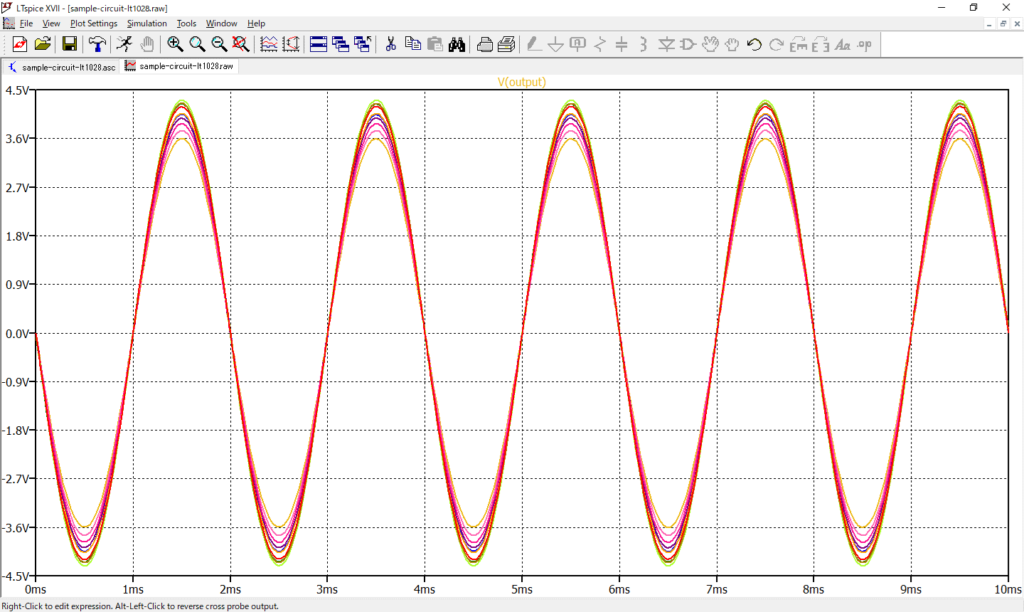
If you check the voltage waveform of OUTPUT, you can see that the error of the feedback resistor R2 of the op-amp causes the output voltage to vary.
In this article, we only used the waveform viewer to check the voltage waveforms of V(OUTPUT) with the voltage probe.
For more information on how to use the waveform viewer, see the following articles:
The schematic used for the monte carlo analysis can be downloaded from the link below.