.wave : LTspice -- Write Selected Nodes to a .Wav File
This article details the use of the dot command ".wave".
".wave" can be used to output the "voltage" or "current" of a specified node as a WAV format audio file.
(WAV or WAVE is a format for audio data description. The file extension is ".wave")
".wave" syntax
The ".wave" syntax is as follows. The "voltage" or "current" of a specified node can be output as a WAV format audio file.
- FileName.wav
Enter the "File Name" of the WAV file to be output; the WAV file will be saved in the same folder as the schematic file that was simulated with ".wave".
You can also specify where to save the WAV file by entering the full path.
- Nbits
Enter the number of quantization bits. The valid range is "1 to 32[bit]".
- SampleRate
Enter the sampling rate (sample rate or sampling frequency). The valid range is "1 to 4,294,967,295 [Hz]".
For accurate sampling, the value must be at least twice the highest frequency of the signal to be sampled.
- V(NodeName)
The signal to be sampled is set by node name and assigned starting with channel 0.
To set multiple signals to be sampled, enter them consecutively by separating them with a space.
For example, in the case of "V(out1) V(out2)," V(out1) ⇒ channel 0, and V(out2) ⇒ channel 1.
Also, "I (NodeName)" can be used to specify the current, and the value remains the same but the unit is converted from A (amperes) to V (volts) for output.
Output Range
- Voltage: ±1V max.
- Current: ±1A max.
Number of Output Channels
- 1 to 65535
Examples of ".wave" command
Three examples of ".wave" commands are shown below:
.wave Output.wav 16 44.1k V(out1)Output the voltage of node "out1" as the file name "Output.wav" with the quantization bit number "16bit" / sampling rate "44.1kHz".
The file is saved in the same folder as the schematic fill where the simulation was run with the ".wave" command.
The digital audio format that can be played on a PC depends on the sound card installed in the PC.
Today, sound chips are often installed on PC motherboards as on-sound boards, so there is no need to purchase a separate sound card if sound quality is not a concern.
In this command example, the quantization bit rate and sampling rate are set in the music CD format that can be played on most on-sound boards.
- Music CD: 16bit/44.1kHz
- High-Resolution Audio: 24bit/96kHz(or 192kHz)
etc.
.wave D:Output.wav 16 44.1k V(out1)Output the voltage of node "out1" as the file name "Output.wav" with the quantization bit number "16bit" / sampling rate "44.1kHz".
The file will be saved to the drive "D" specified by the full path.
.wave Output.wav 16 44.1k V(out1) V(out2)Output the voltage of node "out1" and "out2" as the file name "Output.wav" with the quantization bit number "16bit" / sampling rate "44.1kHz".
Since multiple nodes are specified, voltage V(out1) and voltage V(out2) are output to channel 0 and channel 1, respectively.
Therefore, when listening to a sound source through stereo speakers or stereo headphones, the voltage V(out1) on channel 0 is heard as L (left) and the voltage V(out2) on channel 1 is heard as R (right).
The file is saved in the same folder as the schematic fill where the simulation was run with the ".wave" command.
Examples of ".wave" simulation
WAV file output" and "WAV file input" are explained as examples of ".wave" simulation.
In addition, if you have never created a schematic in LTspice, please refer to the following article.
WAV File Output
Create a voltage source-only circuit and output a WAV file using ".wave".
We have also prepared a pre-made schematic here, which you can download by clicking on the link below if you would like to start the simulation immediately.
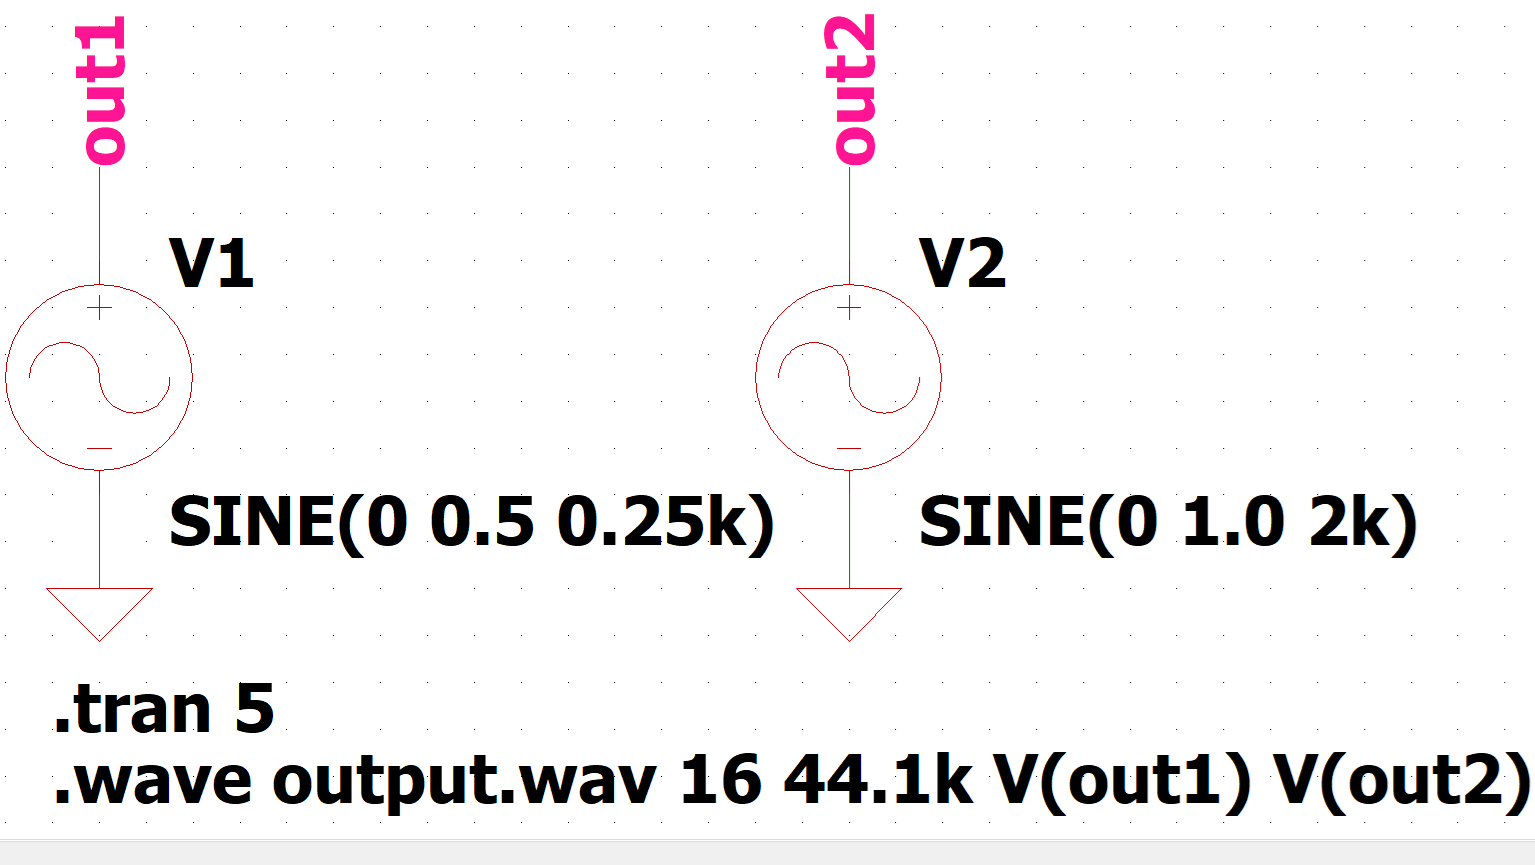
Create a schematic consisting of power, GND, and nodes as shown below.
Also, set the voltage source V1 to an amplitude of 0.5[V] and a frequency of 0.25[kHz], and the voltage source V2 to an amplitude of 1.0[V] and a frequency of 2[kHz]. Set transient analysis to 5[s].
Note that human speech is said to occur between 250 to 2000[Hz](0.25~2[kHz]).
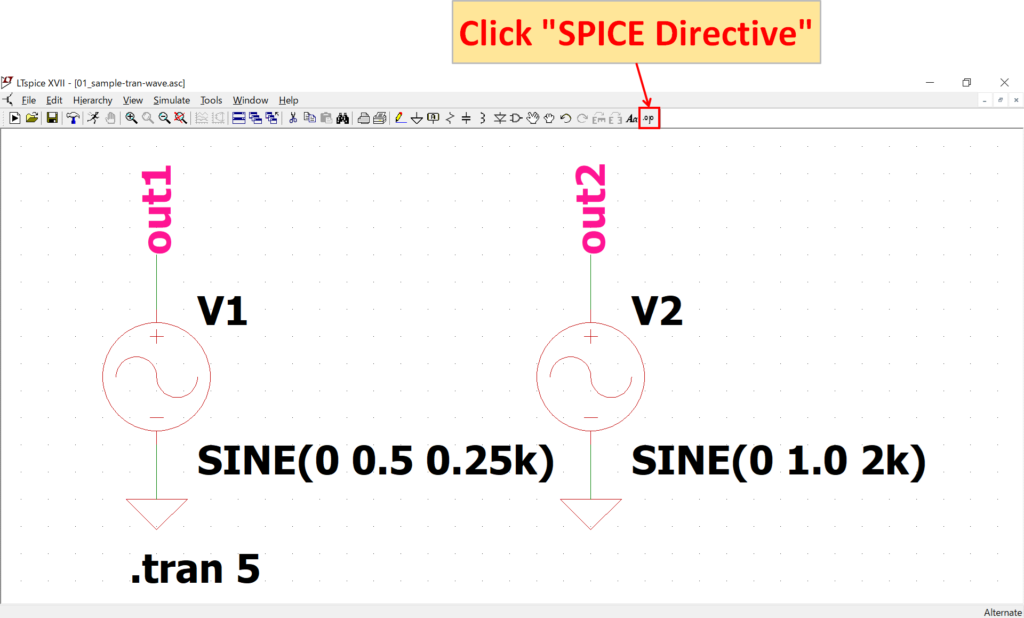
After creating the schematic, click "SPICE Directive" on the toolbar.
For a detailed explanation of transient analysis (.tran), please refer to the following article.
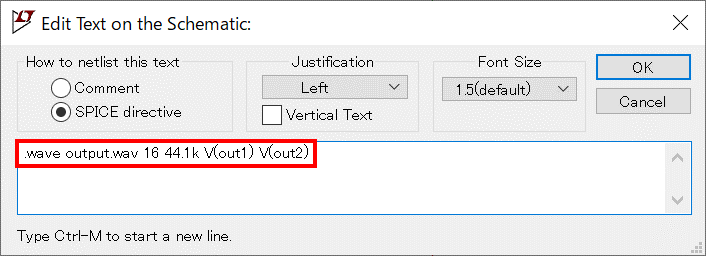
The ".wave" syntax is described and placed as follows:
.wave output.wav 16 44.1k V(out1) V(out2)This time, as in command example 3, the voltage at node "out1" is output as the file name "Output.wav" with the quantization bit number "16bit" / sampling rate "44.1kHz".
Since multiple nodes are specified, voltage V(out1) and voltage V(out2) are output to channel 0 and channel 1, respectively.
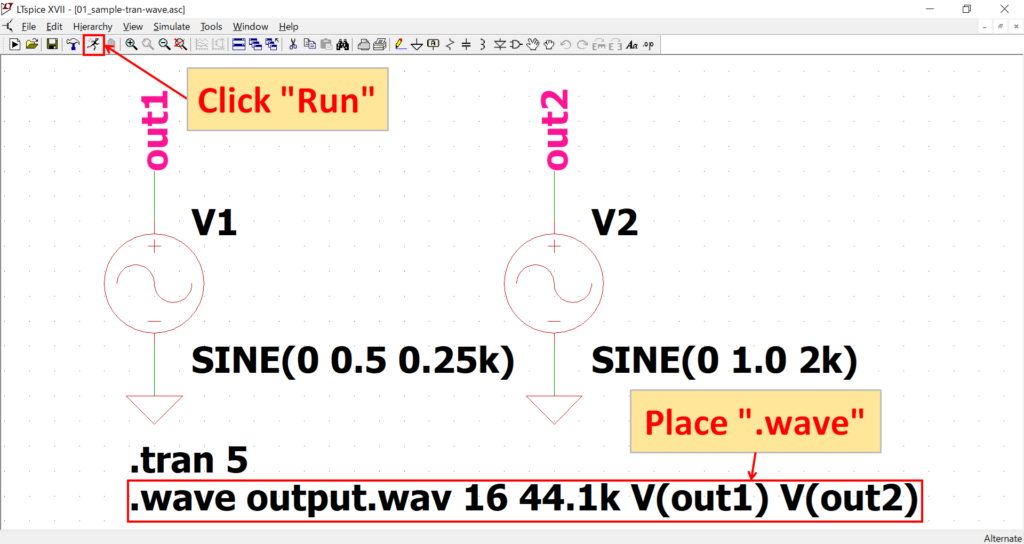
After placing the ".wave" syntax, click "Run" on the toolbar.
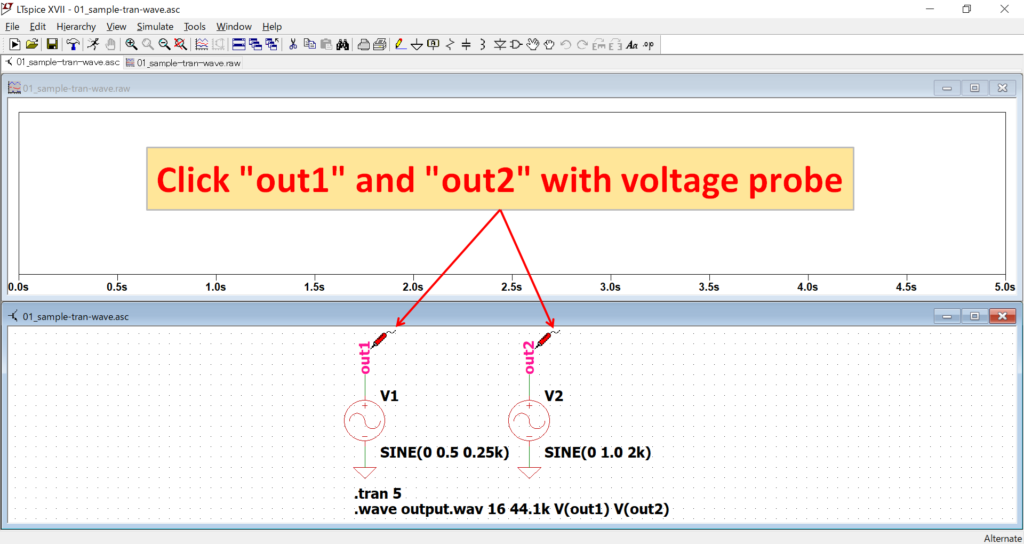
After the simulation is complete, click on nodes "out1" and "out2" with the voltage probe, respectively.
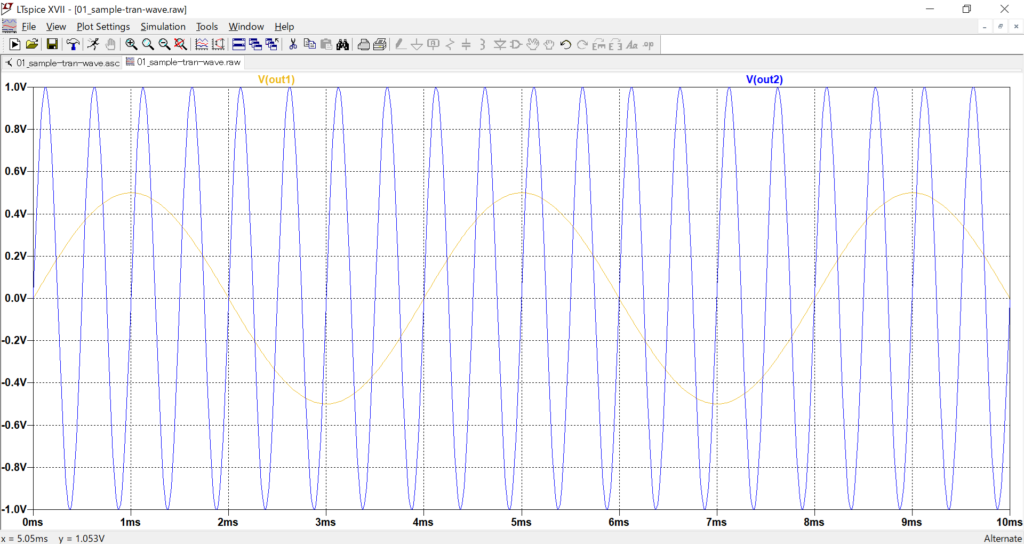
The transient analysis was set to 5[s], which makes it difficult to see the waveform displayed on the graph.
Therefore, using the waveform viewer, change the Right (the maximum value on the right side of the scale) to 10[ms] in the X-axis setting (Horizontal Axis).
The voltage at node "out1" is output with an amplitude of 0.5[V] and a frequency of 0.25[kHz], and the voltage at node "out2" is output with an amplitude of 1.0[V] and a frequency of 2[kHz].
For a detailed explanation of the Waveform Viewer, please refer to the following article.
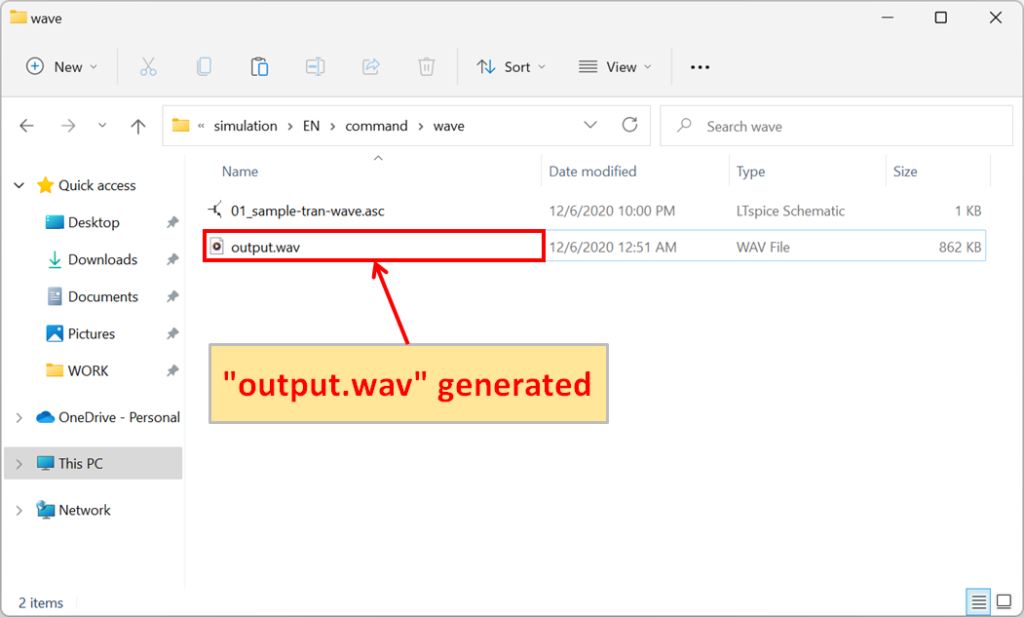
If you check the same folder as the schematic you have just run the simulation on, you will see that "output.wav" has been generated.
When "output.wav" is played back in stereo, channel 0 with amplitude 0.5[V]/frequency 0.25[kHz] is heard in L (left) and channel 1 with amplitude 1.0[V]/frequency 2[kHz] is heard in R (right).
Therefore, if you actually listen with stereo speakers or stereo headphones, you will hear a lower sound from L (left) and a higher sound from R (right), and you will notice that the sound from R (right) is louder than the sound from L (left).
The schematic used for the "WAV file output" simulation can be downloaded from the following link.
WAV File Input
By creating a circuit with only a voltage source and writing the syntax to load a WAV file for the voltage source settings, the waveform data from the WAV file is input.
We have also prepared a pre-made schematic here, which you can download by clicking on the link below if you would like to start the simulation immediately.
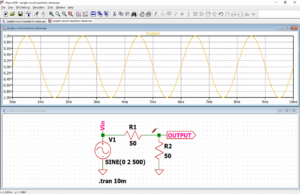
Modify the schematic used in section "WAV File Output".
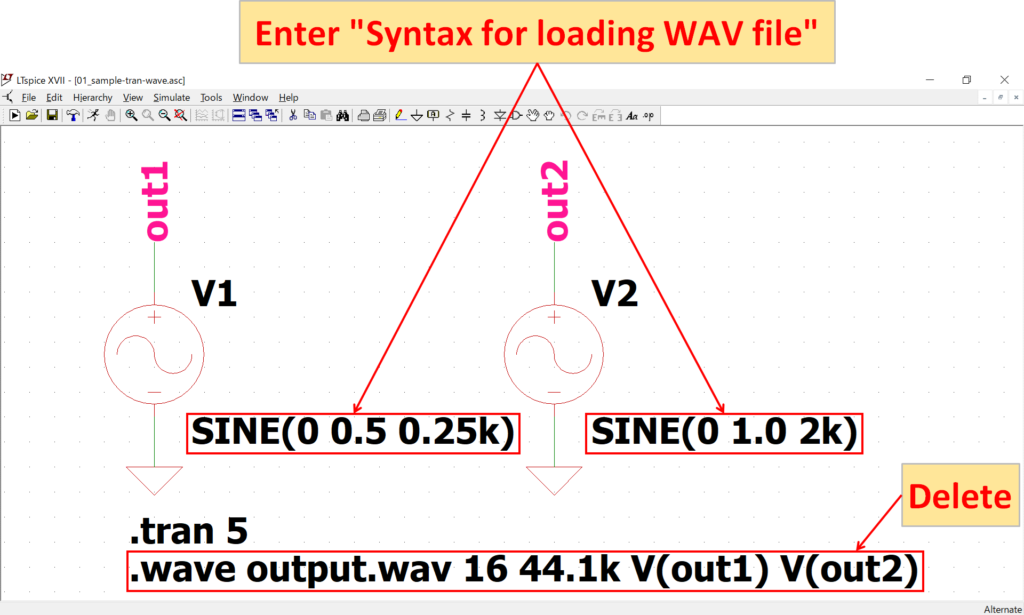
Right-click on the voltage values for voltage sources V1 and V2 and enter "Syntax for loading WAV file".
Also, remove the ".wave" syntax, which is not used in this simulation.
The "Syntax for loading WAV files" is described as follows:
V1
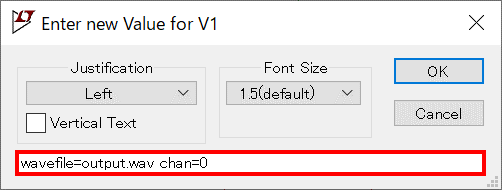
wavefile=output.wav chan=0V2
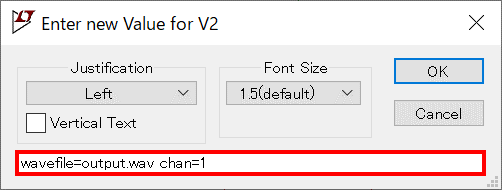
wavefile=output.wav chan=1This time, load the WAV file "output.wav" generated in section "WAV File Output".
For voltage source V1, load the signal waveform of channel 0 of "output.wav" and for voltage source V2, load the signal waveform of channel 1 of "output.wav", respectively.
The "Syntax for loading a WAV file" is as follows. Specify the WAV file name and channel to load the waveform data from the WAV file.
An example of the "Syntax for loading a WAV file" is shown below:
wavefile=output.wav chan=0Command example 1 loads channel 0 of the WAV file "output.wav" in the same folder as the schematic file in which the simulation is to be run. Note that if no channel number is specified, channel 0 is automatically specified.
wavefile=D:output.wav chan=1Command example 2 loads channel 1 of the WAV file "output.wav" located in drive D. Thus, by specifying the WAV file by its full path, it is possible to refer to it even if it is not in the same folder as the schematic file where the simulation is to be run.
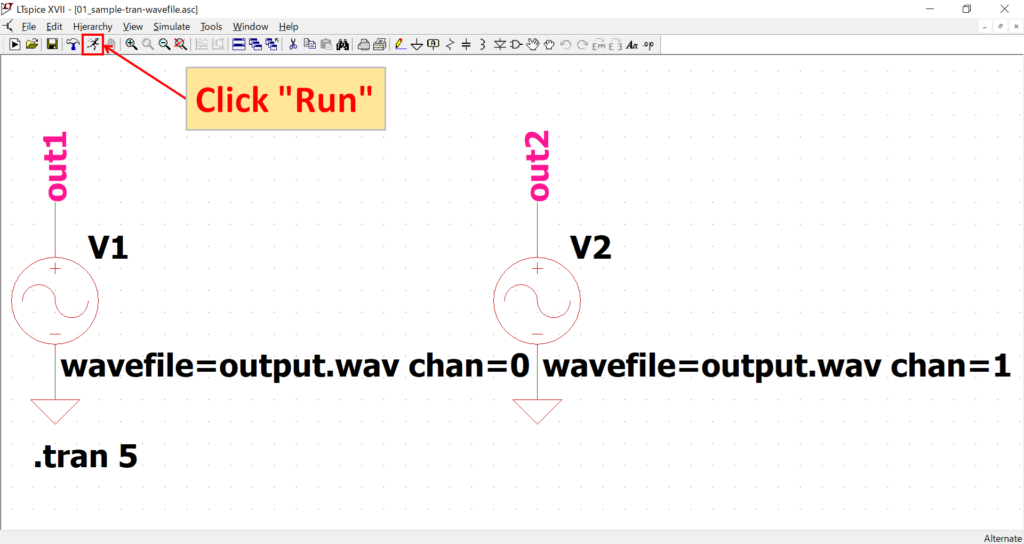
After completing the modification of the schematic, click "Run" on the toolbar.
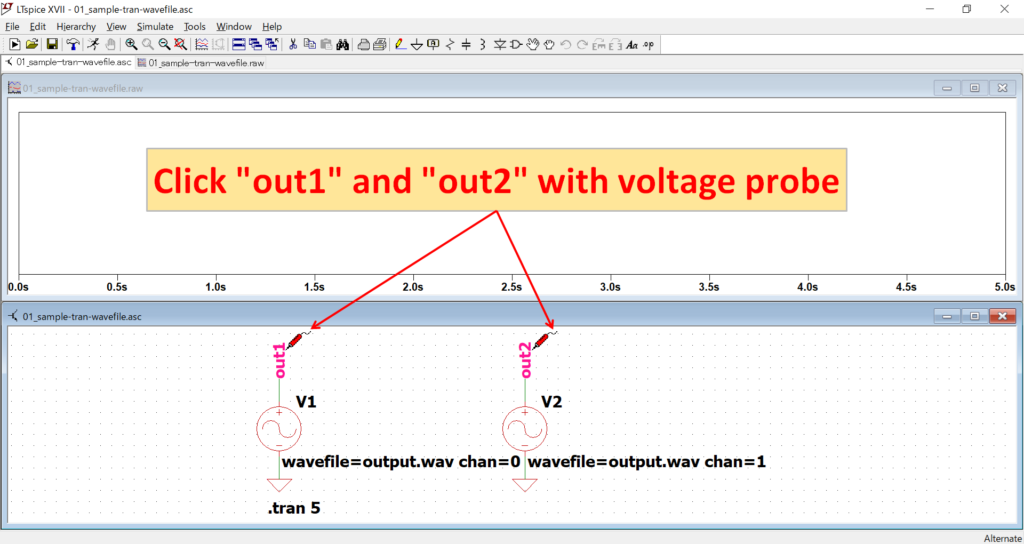
After the simulation is complete, click on nodes "out1" and "out2" with the voltage probe, respectively.
The transient analysis was set to 5[s], which makes it difficult to see the waveform displayed on the graph.
Therefore, using the waveform viewer, change the Right (the maximum value on the right side of the scale) to 10[ms] in the X-axis setting (Horizontal Axis).
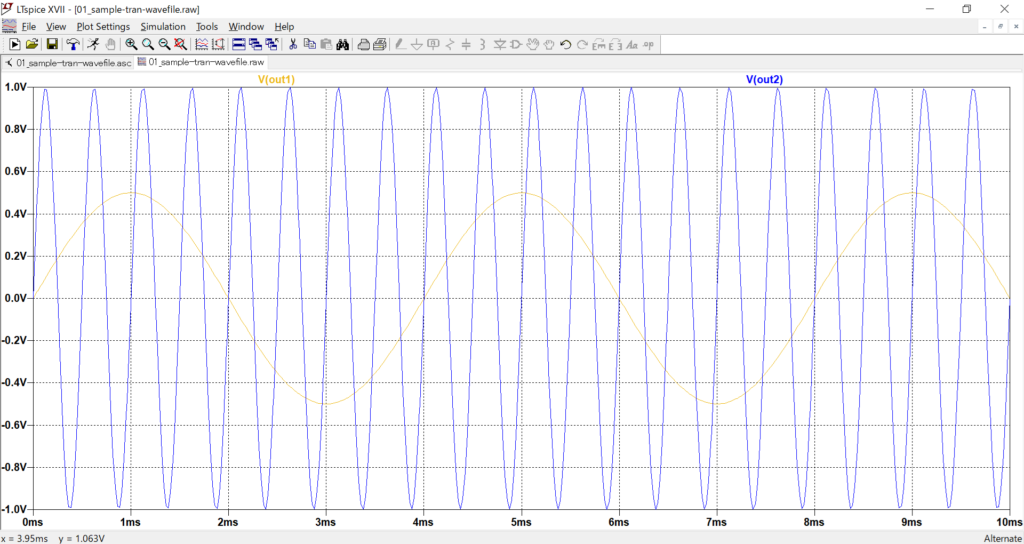
The voltage at node “out1” is output with an amplitude of 0.5[V] and a frequency of 0.25[kHz], and the voltage at node “out2” is output with an amplitude of 1.0[V] and a frequency of 2[kHz].
This indicates that the signal waveform in "output.wav" has been loaded correctly.
In addition, LTspice can use the FFT function to perform detailed spectrum analysis of the audio of input WAV files.
For a detailed explanation of the Waveform Viewer, please refer to the following article.
The schematic used for the "WAV file input" simulation can be downloaded from the following link.