.measure/.meas : LTspice -- Evaluate User-Defined Electrical Quantities

This article details the use of the dot command ".measure(.meas)".
By using ".measure", you can measure voltage and current values more easily than using the cursor function of a waveform viewer.
What is ".measure"?
".measure" is a dot command that automatically measures voltage and current values during simulation.
First, let's try to simulate using ".measure" with the schematic created in the following article.
The schematic can be downloaded from the link below.
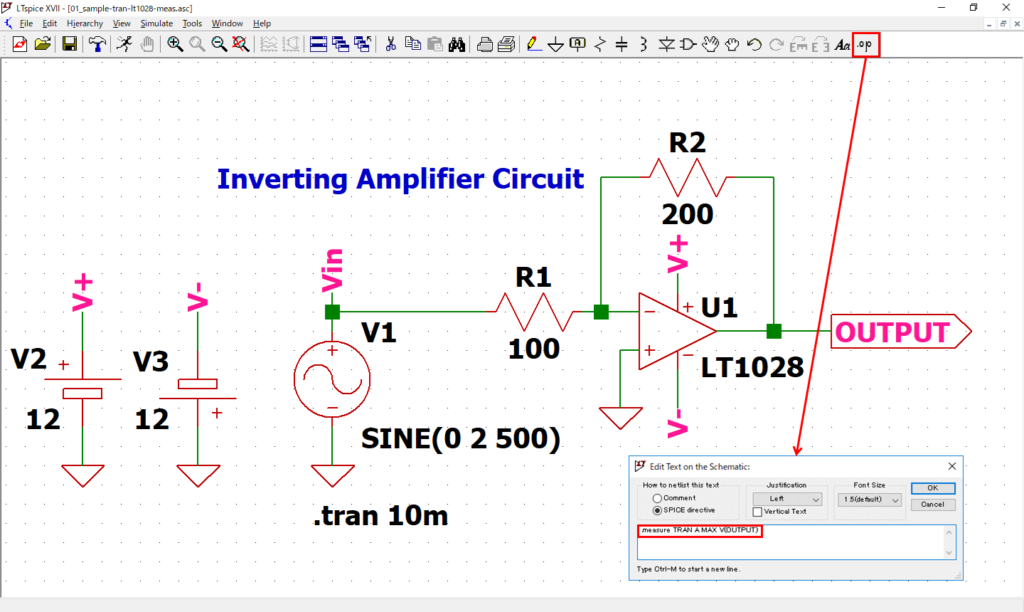
Open the schematic "01_sample-tran-lt1028.asc" and enter the following the ".measure" syntax in "SPICE Directive".
.measure TRAN A MAX V(OUTPUT)This syntax means to measure the maximum voltage of V(OUTPUT) with the label "A".
Both ".measure" and ".means" have the same meaning.
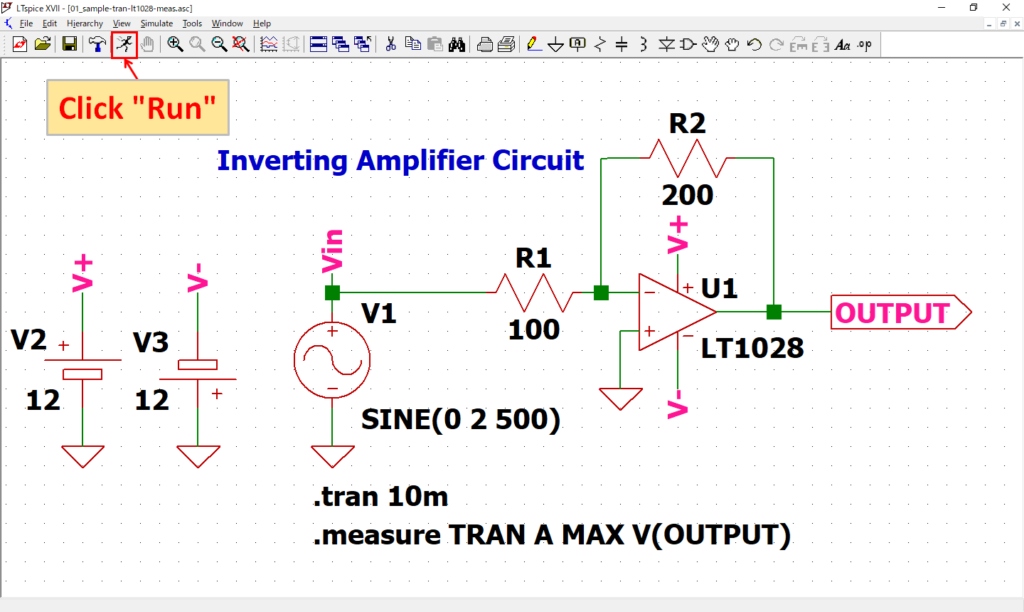
After placing the ".measure" syntax, click "Run" to run the simulation.
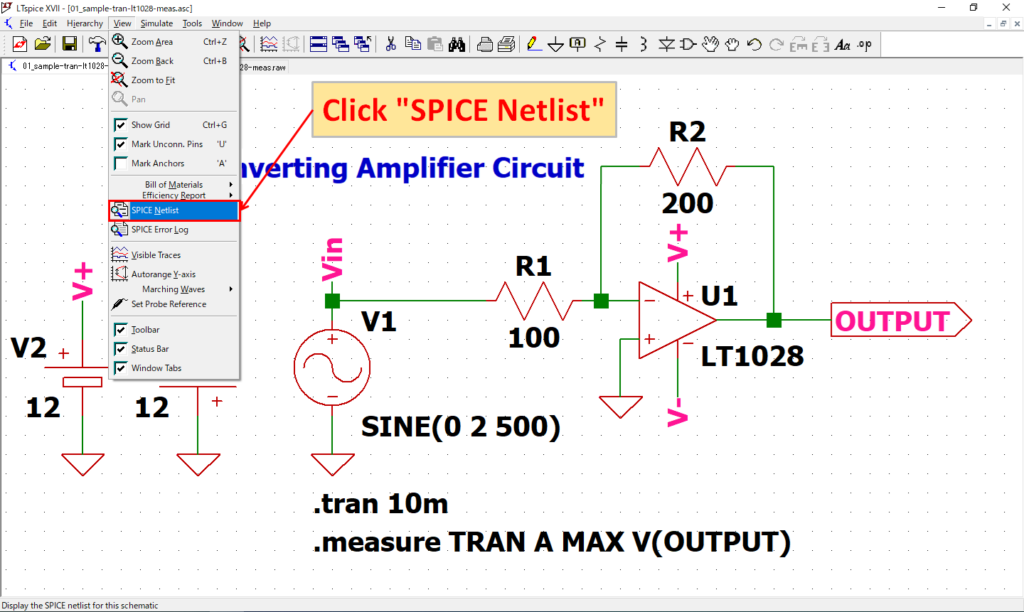
Select "View-SPICE Error Log" to open the log file.
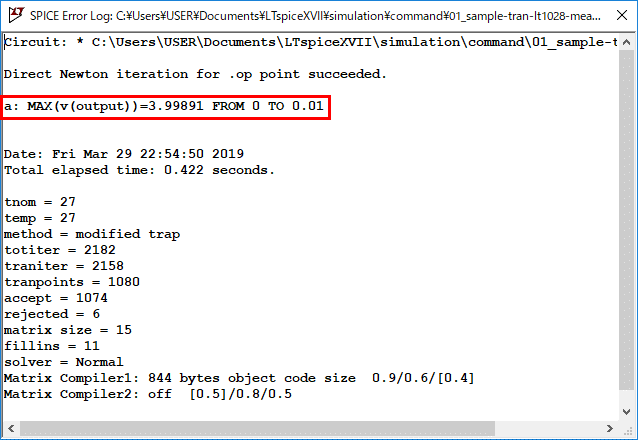
If you open the log file, you will see the following description.
a: MAX(v(output))=3.99891 FROM 0 TO 0.01Thus, by using the dot command ".measure", voltage and current values can be easily calculated as numerical values.
This command is more convenient and reliable than using the cursor in a waveform viewer to calculate.
The schematic used for the ".measure" simulation can be downloaded from the following link.
".measure" syntax
The usage of the ".measure" syntax is classified into "specify the Measurement Range on the Time Axis (X-Axis)" and "specify the Measurement Point on the Time Axis (X-Axis)" as follows.
Specify the Measurement Range on the Time Axis (X-Axis)
Specify the Measurement Point on the Time Axis (X-Axis)
Common Settings
This section describes common settings in the ".measure" syntax.
Analysis Type
| Analysis Type | Explanation |
|---|---|
| TRAN | Transient Analysis |
| AC | AC Analysis |
| DC | DC Sweep Analysis |
| NOISE | Noise Analysis |
| TF | DC Transfer Function Analysis |
| OP | DC Operating Point Analysis |
Describes the analysis type in the simulation. For example, if the simulation in section "What is ".measure"?" was ".tran 10m", you would write "TRAN".
Label
Specify any alphanumeric character. In the simulation in section "What is ".measure"?", the label "A" was specified, so "a" appears at the beginning of the sentence, as shown in the log file below.
(Even if the label is written in uppercase, it will be in lowercase.)
Therefore, if you are measuring the maximum voltage with the ".measure" syntax, you should specify the alphanumeric characters of the label for your own clarity, such as "v-max" for the label.
Node Name & Part No.
| Node Name & Part No. | Explanation |
|---|---|
| V(NodeName) | "Voltage" to be measured |
| I(PartNumber) | "Current" to be measured |
Specify the voltage or current to be measured with the ".measure" syntax. For voltage, specify the node number; for current, specify the part number.
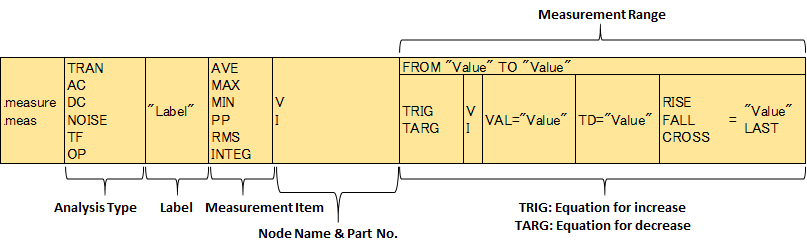
Specify the Measurement Range on the Time Axis (X-Axis)
This section describes how to "specify the measurement range on the time axis (x-axis)" in the ".measure" syntax.
Measurement Item
| Measurement Item | Explanation |
|---|---|
| AVE | average value |
| MAX | maximum value |
| MIN | minimum value |
| PP | Peak-to-Peak |
| RMS | Root-Mean-Square Value(Effective Value) |
| INTEG | Integral Value |
As shown above, it is possible to measure average, maximum, minimum, PP, RMS, and integral values.
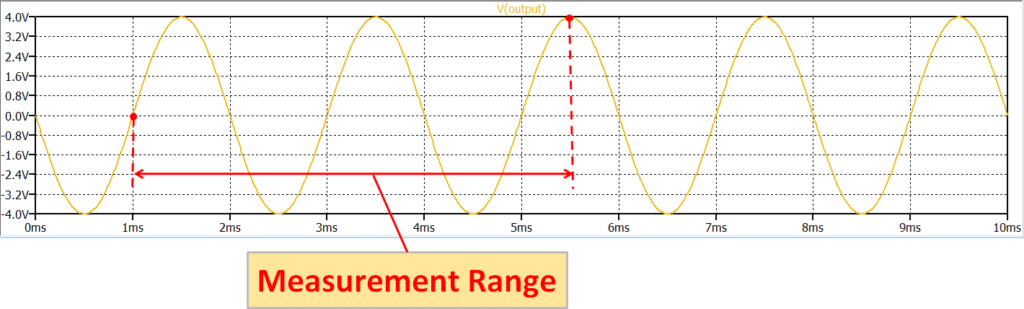
Measurement Range
The measurement range is described by "FROM value TO value". For example, if the measurement range is from 0msec to 5msec in the simulation results, it would be as follows.
FROM 0 TO 5mIf "FROM value TO value" is not described, all times are in the measurement range.
TRIG: Equation for increase/TARG: Equation for decrease
"TRIG: Equation for increase/TARG: Equation for decrease" is a rather complex setup, so we plan to explain how to create the syntax using the ".means Statement Editor" in the section "examples of ".measure" simulation".
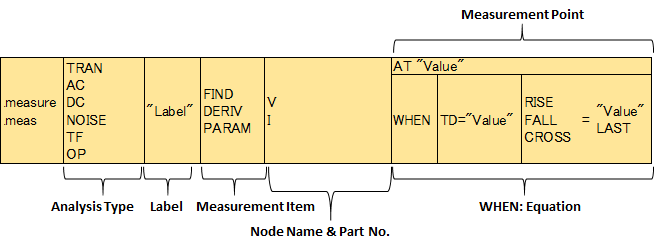
Specify the Measurement Point on the Time Axis (X-Axis)
This section describes how to "specify the measurement point on the time axis (x-axis)" in the ".measure" syntax.
Measurement Item
| Measurement Item | Explanation |
|---|---|
| FIND | Instantaneous Value |
| DERIV | Differential Value |
| PARAM | Numerical Calculation |
As shown above, it is possible to measure instantaneous and differential values. It is also possible to perform numerical calculation in PARAM.
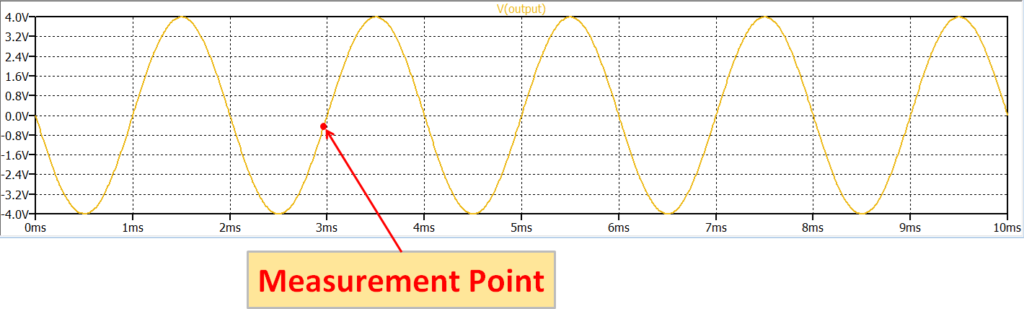
Measurement Point
The measurement point is described by "AT value". For example, if the measurement point is at 5msec in the simulation results, it would be as follows.
AT 5mWHEN: Equation
"WHEN: Equation" is a rather complex setup, so we plan to explain how to create the syntax using the ".means Statement Editor" in the section "examples of ".measure" simulation".
Examples of ".measure" simulation
It may be difficult to understand the ".measure" syntax with just a description, so we will actually simulate ".measure" as some examples.
Specify the Measurement Range on the Time Axis (X-Axis)
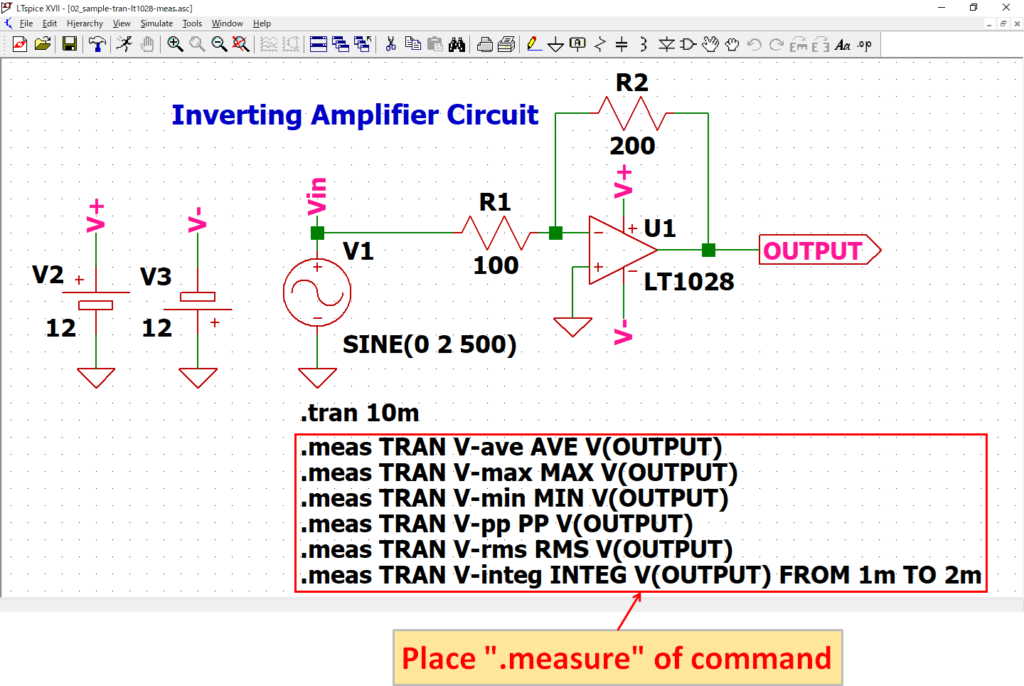
Open the schematic "01_sample-tran-lt1028.asc" and enter the following ".measure" in "SPICE Directive".
.meas TRAN V-ave AVE V(OUTPUT)
.meas TRAN V-max MAX V(OUTPUT)
.meas TRAN V-min MIN V(OUTPUT)
.meas TRAN V-pp PP V(OUTPUT)
.meas TRAN V-rms RMS V(OUTPUT)
.meas TRAN V-integ INTEG V(OUTPUT) FROM 1 TO 2m
After placing the ".measure" syntax, click "Run" to run the simulation.
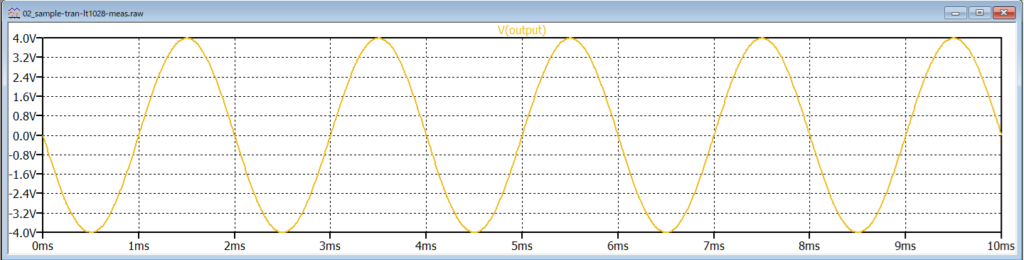
The results of the simulation and the ".measure" syntax are as follows.
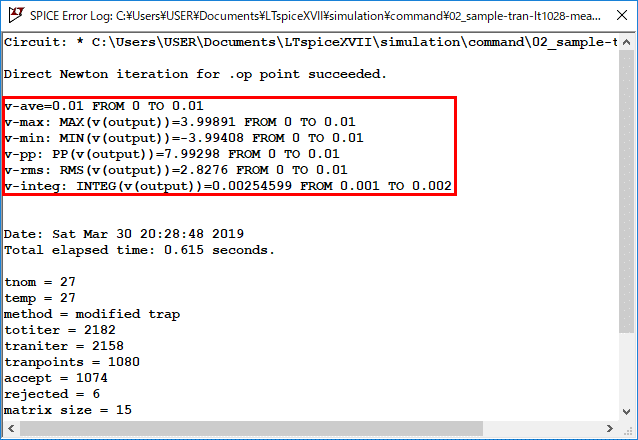
v-ave=0.01 FROM 0 TO 0.01
v-max: MAX(v(output))=3.99891 FROM 0 TO 0.01
v-min: MIN(v(output))=-3.99408 FROM 0 TO 0.01
v-pp: PP(v(output))=7.99298 FROM 0 TO 0.01
v-rms: RMS(v(output))=2.8276 FROM 0 TO 0.01
v-integ: INTEG(v(output))=0.00254599 FROM 0.001 TO 0.002
If you compare the results with the waveform graph in the waveform viewer, you can see that the results are almost identical.
The schematic used for the ".measure" simulation can be downloaded from the following link.
Specify the Measurement Point on the Time Axis (X-Axis)
Open the schematic "01_sample-tran-lt1028.asc" and enter the following ".measure" in "SPICE Directive".
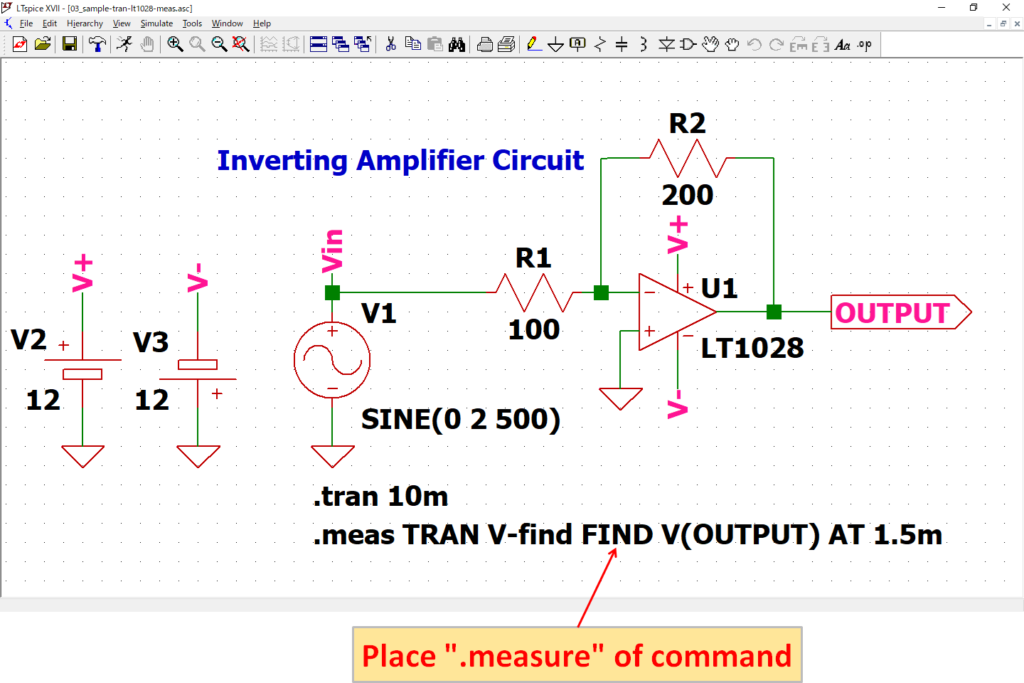
.meas TRAN V-find FIND V(OUTPUT) AT 1.5mAfter placing the ".measure" syntax, click "Run" to run the simulation.
The results of the simulation and the ".measure" syntax are as follows
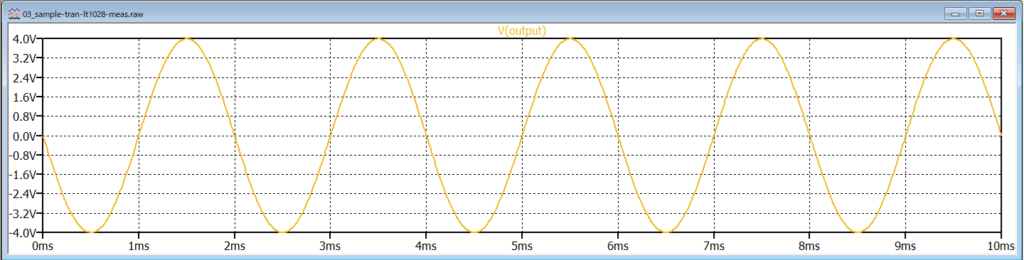
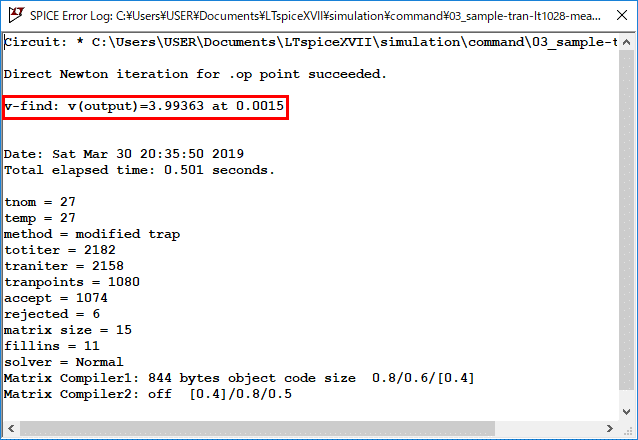
v-find: v(output)=3.99363 at 0.0015If you compare the results with the waveform graph in the waveform viewer, you can see that the results are almost identical.
The schematic used for the ".measure" simulation can be downloaded from the following link.